Fig. 3.

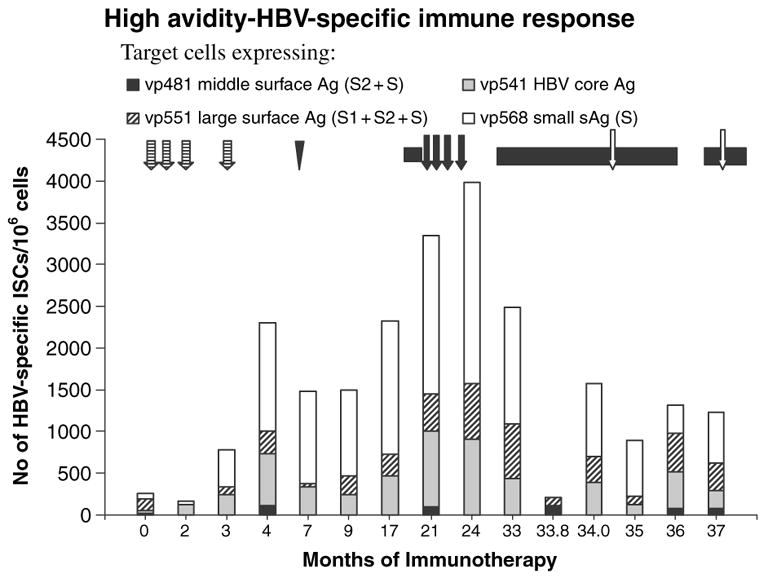
High avidity T-cell responses to target cells expressing HBcAg and small, middle, and large HBV surface antigen proteins. Symbols for treatment strategies are as shown in Fig. 1.

High avidity T-cell responses to target cells expressing HBcAg and small, middle, and large HBV surface antigen proteins. Symbols for treatment strategies are as shown in Fig. 1.