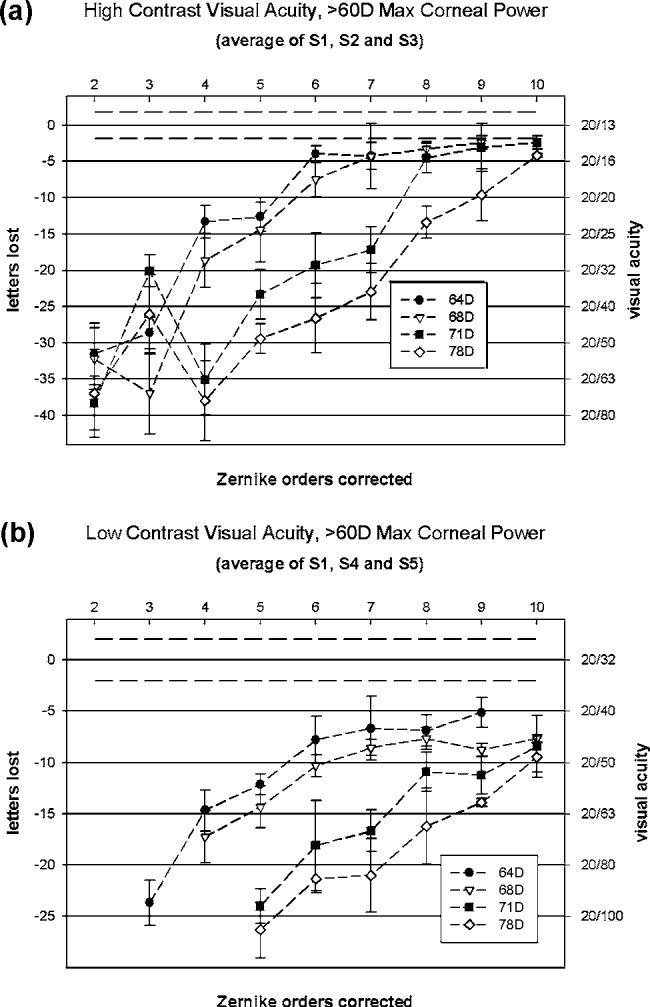
Fig. 5.

Letters-lost mean of means for both (a) high- and (b) low-contrast VA charts convolved with PSFs derived from keratoconic wavefront errors for corneas having >60 D maximum corneal power. Letters lost from baseline (left vertical axis) is plotted as a function of Zernike orders corrected. Letters lost is converted to VA (right vertical axis). Zero letters lost from base-line corresponds to an average acuity of 20/13 for high contrast and 20/32 for low contrast. As corneal power increases, the number of Zernike orders required for optimal correction increases. Dashed lines represent one standard deviation of the scores on “perfect” charts. All tested points are plotted.
