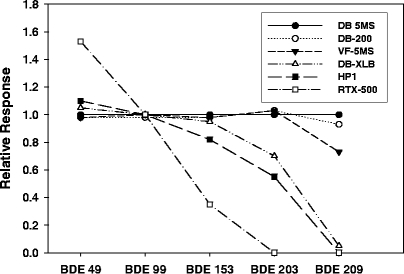
Fig. 2.

The relative response of five selected BDE congeners using different gas chromatography capillary columns. The response for DB-5MS was set to 1. Mean values are plotted (n=5) and the error bars correspond to the standard deviation. (Reprinted from Björklund et al. [17] with permission)
