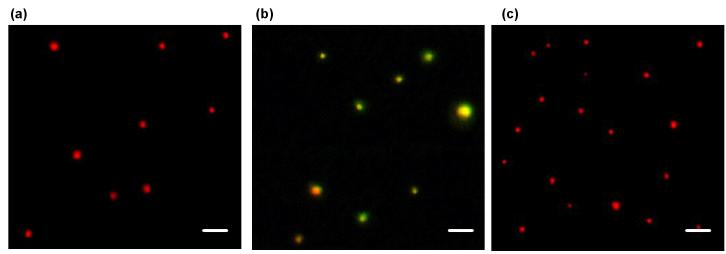
Fig. 3.
Fluorescent image analysis of single QD-FRET nanocomplexes. Fluorescence images of (a) 605QD-labeled pDNA, (b) nanocomplexes, and (c) disrupted nanocomplexes. 605QD and FRET-mediated Cy5 signals are pseudo-colored in red and green, respectively. Colocalization is displayed in yellow/orange and indicates the tight association of plasmid and polymer within intact QD-FRET nanocomplexes. After treatment with heparin and chitosanase, nanocomplexes were disrupted and no longer exhibited FRET or colocalized signals. Scale bar: 1 μm.

