Fig. 4.
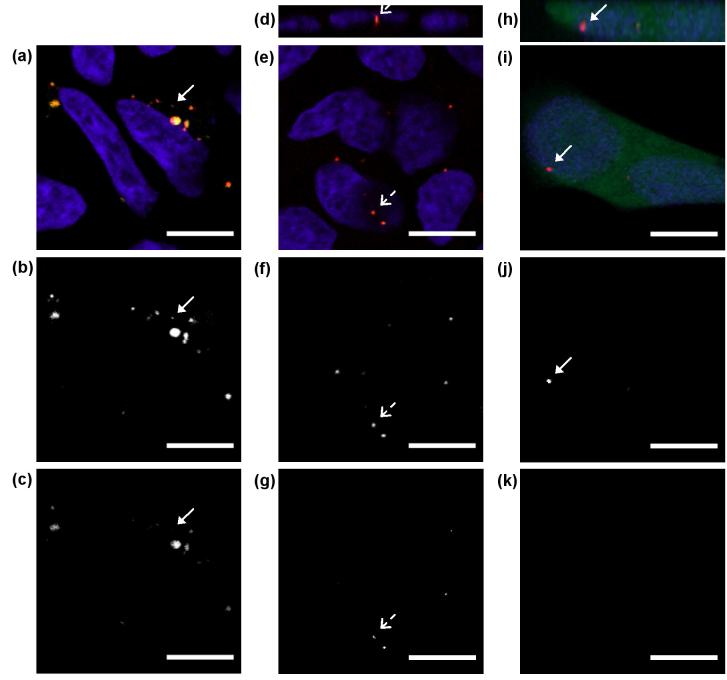
Intracellular distribution of QD-FRET nanocomplexes. (a)-(c) HEK293 cells at 24 h post-transfection. Most nanocomplexes remained intact (Cy5, yellow/orange) and localized around the nucleus (blue). The onset of QD-labeled DNA release (red only in panel a) was detected at this time point. Only QD signal was detected (arrow, panel b) and not Cy5 (arrow, panel c) for the released plasmid. Grayscale images for each individual channel for 605QD and Cy5 are shown in the bottom two rows, respectively. (d)-(g) At 48 h post-transfection, most nanocomplexes have unpacked and released DNA (red only) in the perinuclear region. Note the intact nanocomplex (broken arrow) found within the nucleus in corresponding panels d-g. Panel d is a z-section showing the nuclear localization of the nanocomplex. (h)-(k) At 72 h post-transfection, a live HEK293 cell expressing GFP due to plasmid released from nanocomplexes. QD-labeled plasmid (arrow) was observed within the nucleus in corresponding panels h-j. Panel h is a z-section showing the nuclear localization of the QD-labeled plasmid. No signal was detected in the Cy5 channel (panel k). Scale bar: 10 μm.

