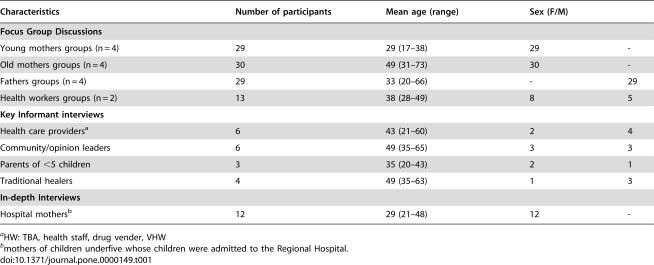
Table 1. Sociodemographic profile of the study participants.
| Characteristics | Number of participants | Mean age (range) | Sex (F/M) | |
| Focus Group Discussions | ||||
| Young mothers groups (n = 4) | 29 | 29 (17–38) | 29 | - |
| Old mothers groups (n = 4) | 30 | 49 (31–73) | 30 | - |
| Fathers groups (n = 4) | 29 | 33 (20–66) | - | 29 |
| Health workers groups (n = 2) | 13 | 38 (28–49) | 8 | 5 |
| Key Informant interviews | ||||
| Health care providersa | 6 | 43 (21–60) | 2 | 4 |
| Community/opinion leaders | 6 | 49 (35–65) | 3 | 3 |
| Parents of <5 children | 3 | 35 (20–43) | 2 | 1 |
| Traditional healers | 4 | 49 (35–63) | 1 | 3 |
| In-depth Interviews | ||||
| Hospital mothersb | 12 | 29 (21–48) | 12 | - |
HW: TBA, health staff, drug vender, VHW
mothers of children underfive whose children were admitted to the Regional Hospital.

