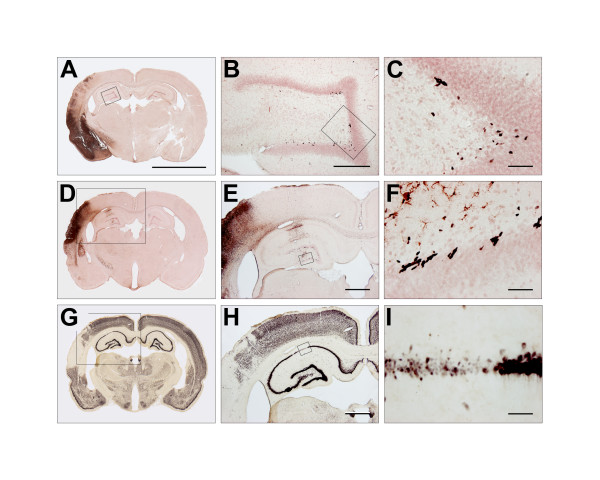
Figure 9.
BrdU, ED-1 and NeuN stains one week after tMCAo. 9A to 9F show the IHC for BrdU and ED-1. BrdU was developed with nickel-enhanced DAB (black), whereas the activated microglia marker ED-1 was visualized with NovaRed® (brownish red). 9A shows a representative example of a tMCAo animal one week after surgery. Four and forty time magnifications of the boxes in 9A and 9B are shown in 9B and 9C, respectively. The BrdU+ cells are typically found in clusters in the subgranular cell layer in DG. Our counting procedure started with delineating the DG. Hereafter, the BrdU+ cells in the whole DG were counted at forty times magnification (9C). We generally observed a very scarce ED-1 expression in the DG unless the hippocampus was directly affected by ischemic injury. 9D to 9I show an example of ischemia affecting the right hippocampus. The boxed area in 9D is shown at higher magnification in 9E. Activated microglia was abundantly seen in a part of the CA-1 and the whole DG. 9F shows a forty time magnification of the box in 9E. Clearly, activated microglia had an intimate relation to an increasing number of BrdU+ cells. Panel 9G to 9I show NeuN IHC developed with nickel-enhanced DAB. 9G and 9H correspond to 9D and 9E. The boxed area in 9H of the CA-1 is shown at forty time magnification in 9I. Note the ischemic degeneration of this part of the CA-1. The scale bar in 9A is 5 mm. In 9B the scale bar represents 300 mm, and in 9E and 9H 1 mm. The scale bars in 9C, 9F and 9I equals 50 μm.

