
Figure 3.
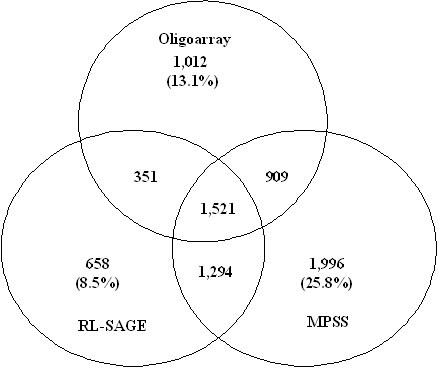
Venn diagram showing qualitative clustering analysis of M. grisea transcriptomes revealed by MPSS, RL-SAGE and oligoarray methods. A total of 7,741 unique genes which were present in all three platforms were used in the analyses. Three method comparison (A) and pair comparison (B) were performed. Only single-hit MPSS and RL-SAGE tags were used to match the sequences on the oligoarray.