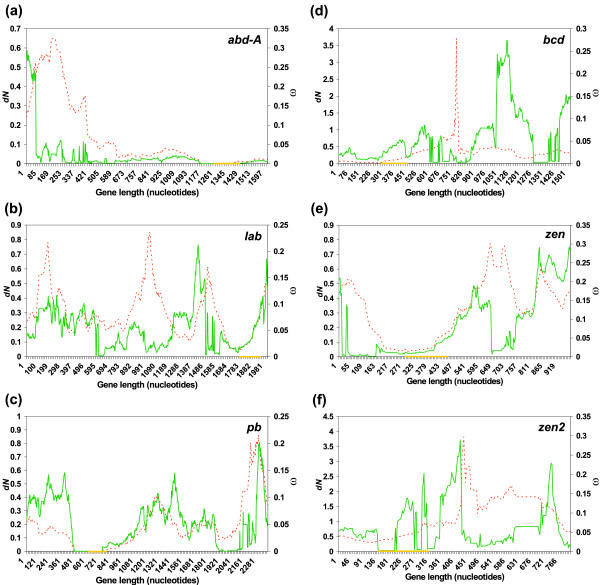
Figure 1.
Distribution of dN and ω in sliding windows along the coding sequence of genes. Distribution of dN (broken line) and ω (solid line) in sliding windows of 240 nucleotides. (a) abd-A, (b) lab, (c) pb, (d) bcd, (e) zen and (f) zen2. In each case, the position of the homeobox is represented by a yellow box within the X axis.

