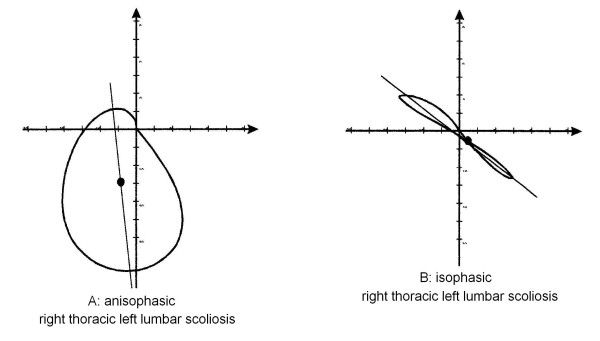
Figure 10.
Graphical representation of the top view in two patients with the same Ponseti, King and Lenke classification, very similar Cobb values, completely different 3D behaviour and consequently 3-DEMO classification; for clinical and 3 DEMO complete data of these patients see Appendix [see Additional file 1].

