
Fig. 7.
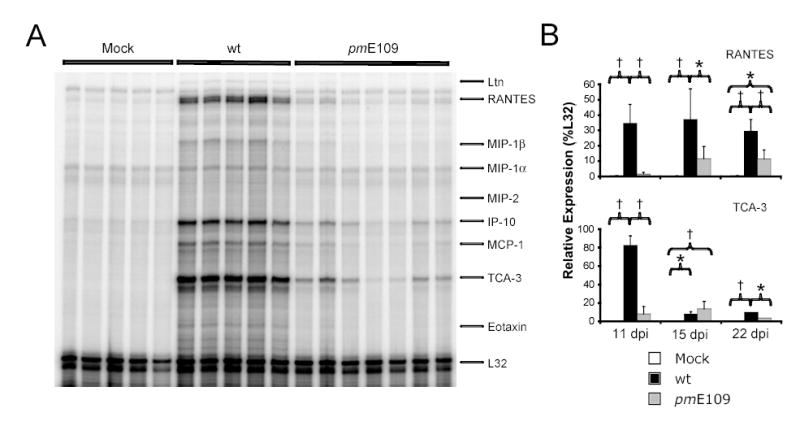
Brain chemokine responses following intranasal infection. Chemokine gene expression was measured in the brains of mice infected i.n. with 105 PFU of wt MAV-1 or pmE109. Animals mock infected with conditioned media were included as controls. Each lane represents data obtained from a separate mouse. (A) Representative assay demonstrating detection by RPA of chemokine gene expression in the brains of infected mice at 11 dpi. (B) Kinetics of chemokine gene expression in the brain for representative chemokine genes over the course of acute infection from three separate infection experiments analyzed as in A. Quantified PhosphorImager data are presented as percentages of the expression of the L32 housekeeping gene. Mean values and standard deviations are presented for between 4 and 7 mice per group at each time point. Statistical significance between groups was determined using ANOVA with subsequent Newman-Keuls analysis between pairs where appropriate (* P < 0.01 and † P < 0.001).