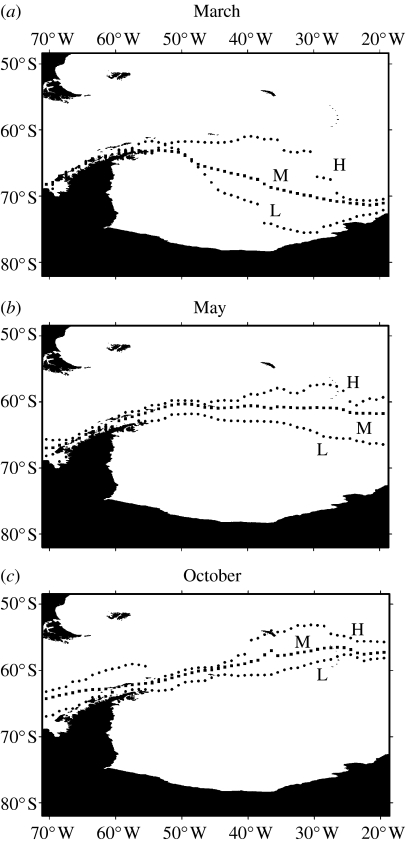
Figure 3.
Seasonal and interannual changes in extent of sea ice across the Scotia Sea and Weddell Sea. Mean positions of the 15% ice edge are shown for three months in the year along with the position of the ice edge in a year of extreme north and south extent. (a) Mean sea ice extent in March (M) and extent in March 1986 (L) and 2004 (H). (b) Mean sea ice extent in October (M) and extent in 1989 (L) and 1987 (H). (c) Mean sea ice extent in May (M) and extent in May 1999 (L) and 1992 (H). Sea ice data from 1979 to 2005 from DMSP–SSMI passive microwave data produced by NOAA/NCEP.

