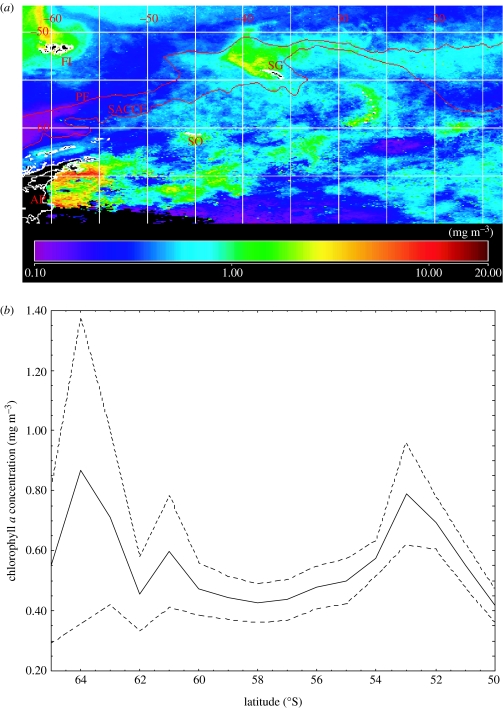
Figure 4.
(a) Mean concentration of chlorophyll a (mg m−3) derived from the summer (December–February) SeaWiFS data for the period from 1998 to 2005. The position of the PF and SACCF are also shown. (b) Mean and 95% confidence intervals of the December–February concentration of chlorophyll a (mg m−3) calculated in 1° latitude bands across the Scotia Sea from 55 to 30° W. Data are from the SeaWiFS Project and the NASA Giovanni Ocean Color Project.

