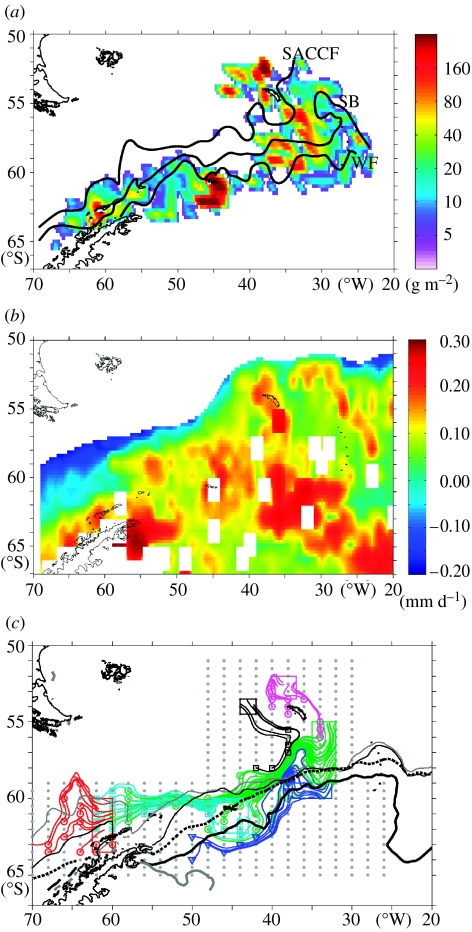
Figure 5.
(a) Krill biomass across the Scotia Sea based on CCAMLR Synoptic Survey during January and February 2000. The positions of the major fronts as determined during the survey are also shown (Murphy et al. 2004a). (b) Estimated growth rates (mm d−1) of krill across the Scotia Sea during January and February 2000. Values based on empirical relationships derived by Atkinson et al. (2006; Calculations use Model 3, Table 5, for all krill sampled) and Tarling et al. (2006) using satellite-derived mean SST field and chlorophyll a (SeaWiFS) concentrations for January and February and assuming a mean length of 40 mm. Blank cells are where no data were available or where the SST was less than −1 or greater than 5°C. (c) Lagrangian particle tracks passing through major biomass regions (a) based on tracks from previous three months using output from the OCCAM circulation model (Murphy et al. 2004a). (a,c) Reproduced from Murphy et al. 2004a with permission from Elsevier.

