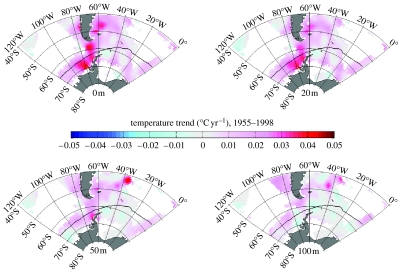
Figure 2.
Trends in ocean summer surface temperature over the period 1955–1998, for four different depth levels (surface 20, 50 and 100 m). Grid cells with no data are left white. Note that the marked warming trend observed close to the Antarctic Peninsula is strongly intensified towards the surface, and decays to almost 0 by 100 m depth. Reproduced, with permission, from Meredith & King (2005).

