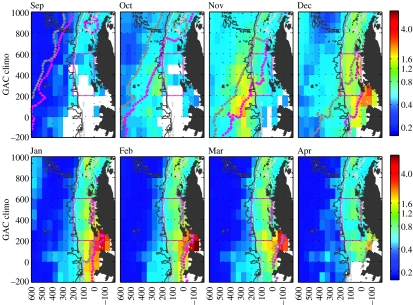
Figure 11.
Monthly mean chlorophyll a time-series (coloured areas, mg m−3, based on 7 years of SeaWiFS data with the Southern Ocean algorithm developed by Dierssen & Smith 2000) for the Palmer LTER study area (pink box). The grey and pink dotted lines show the mean ice edge position at the start and end of each month, respectively. White areas denote regions where cloud or ice cover precluded firm chlorophyll estimates.

