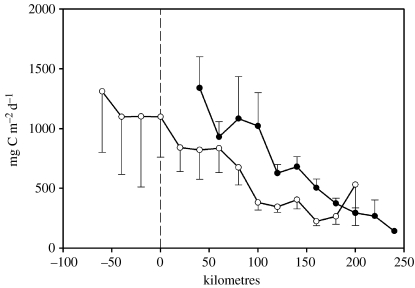
Figure 12.
Spatial variability in average January integrated production across the shelf. Estimated from 6 January cruises between 1994 and 2000 (mean and 95% confidence intervals). Solid circles, 600 line stations off Anvers Island; open circles, 200 line off Marguerite Bay (figure 1a).

