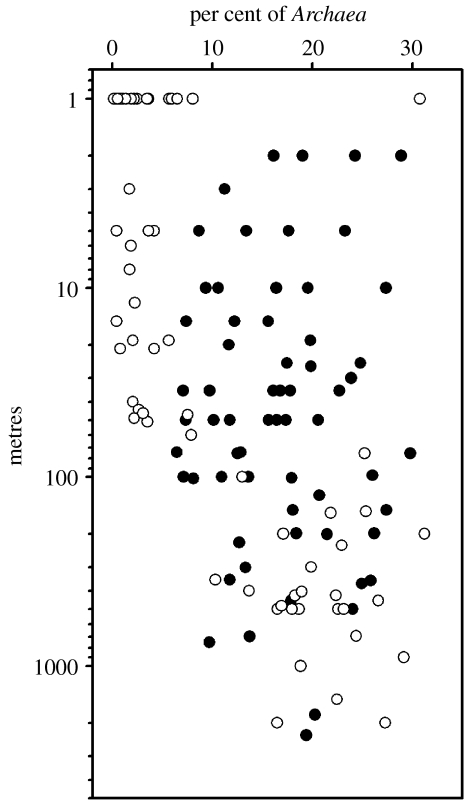
Figure 13.
Depth profiles from the LTER study grid (figure 1) showing the relative proportion of picoplankton cells identified as Archaea or Bacteria using poly-fluorescent in situ hybridization (FISH) probes (Church et al. 2003). Filled circles, winter samples (June–July, 1999); open circles, summer samples (January, 1999).

