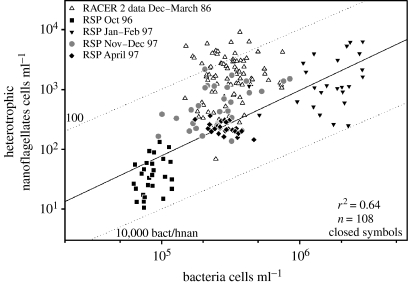
Figure 14.
The ratio of bacterial to heterotrophic nanoflagellate (bacteriovore, HNAN) abundance in the Gerlache Strait, WAP (open symbols) and the Ross Sea (closed symbols). The dotted lines indicate fixed ratios of 100, 1000 and 10 000 bacteria per HNAN. Gerlache data courtesy of D. Bird, Université de Québec à Montréal.

