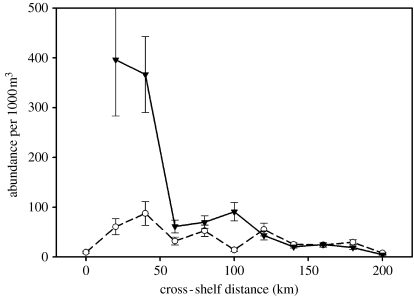
Figure 15.
Gradients in abundance of Euphausia superba within the Palmer LTER region in January. Mean abundance (1993–2004) with standard error for abundance within standard grid cells 100 km alongshore and 20 km on/offshore. Abundance estimates from the delta distribution (Ross et al. in press). Abundance data shown for the 600 line (inverted triangles) just south of Anvers Island, and the 200 line (open circles) which enters Marguerite Bay just south of Adelaide Island.

