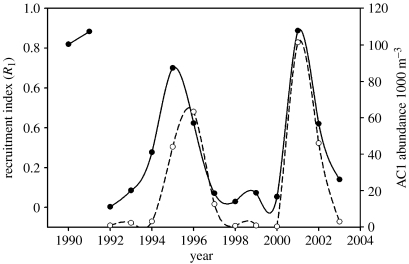
Figure 16.
Time-series of recruitment index (R1, filled circles, solid line) and abundance of AC1s (open circles, dashed line) calculated from length-frequency distributions of Euphausia superba with the maximum likelihood fitting procedure of de la Mare (1994) as used in the program CMIX. Krill were sampled in the full summer Pal-LTER study region in January of the years 1993–2004, and in a restricted sampling region in November 1991. The year class is identified from the year of the January of the spawning season. Series extended from that presented in Quetin & Ross (2003). The two estimates of R1 for year class 1990 and 1991 were estimated either from R2 (YC1990) or from a restricted sampling region (YC1991). Strong year classes are denoted either by high R1s (greater than 0.4) and/or high abundance of AC1s (greater than 40×1000 m−3).

