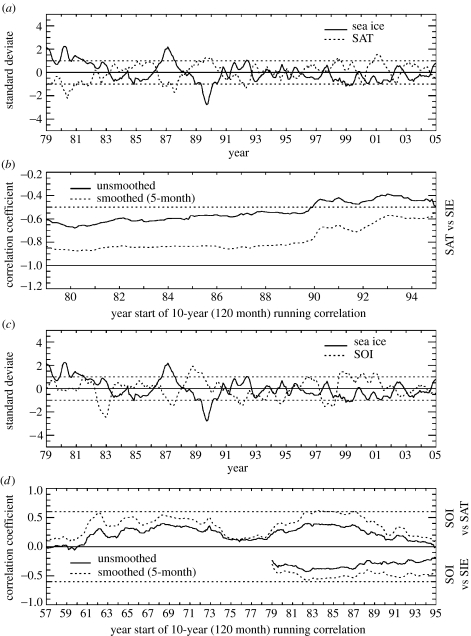
Figure 3.
Monthly standard deviates (smoothed by 5-month running means) from January 1979 to December 2004. Monthly standard deviates were determined by dividing the anomaly (for the month and year in question) by the standard deviation of the anomaly (for the month in question). (a) Faraday/Vernadsky air temperature (dotted) and Palmer LTER sea ice extent (solid); (b) 10-year (120 month) running correlations between unsmoothed (solid) and smoothed (dotted) time-series of Faraday/Vernadsky air temperature and Palmer LTER sea ice extent: the smoothing was by 5-month running means; (c) Palmer LTER sea ice extent (solid) and the Southern Oscillation Index (SOI; dotted); and (d) 10-year (120 month) running correlations between unsmoothed (solid) and smoothed (dotted) time-series of Faraday/Vernadsky air temperature and SOI (positive correlations from 1957 to 1995), and between unsmoothed (solid) and smoothed (dotted) time-series of Palmer LTER sea ice extent and the SOI (negative correlations from 1979 to 1995).

