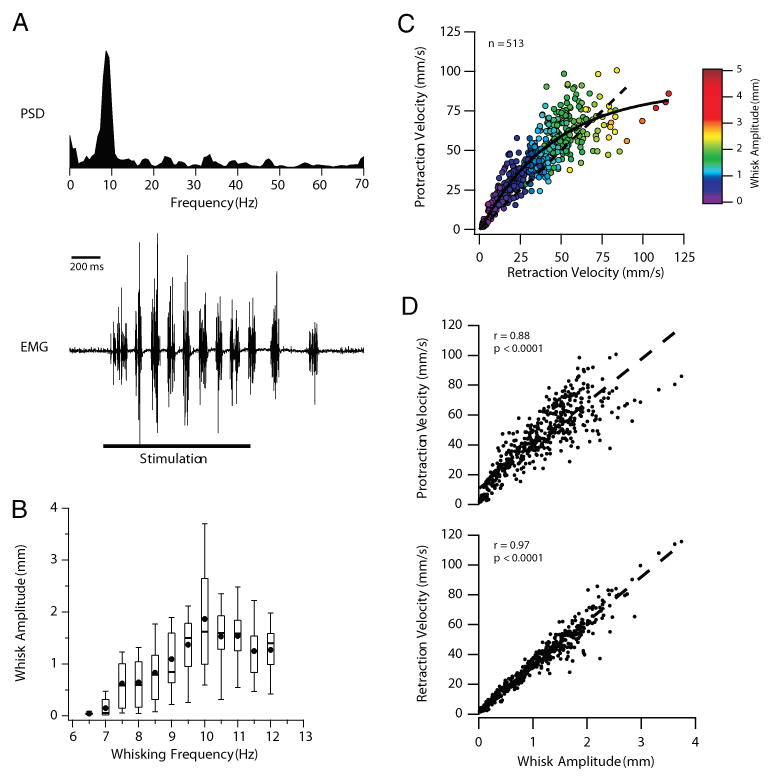
FIG. 1.

Intracortical microstimulation (ICMS)–evoked whisking in the anesthetized rat. A: power spectral density (PSD, top) of the intrinsic EMG (bottom)—evoked by ICMS of vibrissa motor cortex (vMCx)—shows a peak at 9 Hz. ICMS parameters: 200-μs pulses at 50 Hz, 125 μA for 1 s. Note the absence of a peak at the stimulation frequency of 50 Hz, indicating that the stimulation is not driving whisking on a cycle-by-cycle basis. Note also that rhythmic whisking outlasts the duration of the stimulation (indicated by the horizontal line). B: larger whisks were generated during higher-frequency whisking epochs. Amplitudes of 513 whisks were binned according to the frequency of their whisking epoch (bin size = 0.5 Hz). Box plots define the 25th and 75th percentiles, whereas the whiskers define the 10th and 90th percentiles. Medians are represented by a line through each box. Solid circles represent the means. C: relationship between retraction velocities and the velocities of the immediately preceding protractions (n = 513). Solid line is the exponential fit of the data. Colors indicate the amplitude of the corresponding whisk. At low whisk amplitudes, most retractions were slower than the preceding protractions (see dashed unity line). As amplitudes increased, retraction velocities exceeded protraction velocities. D: whisk amplitudes are highly correlated with the velocities of both whisk protractions (top) and retractions (bottom), but the correlation with retraction velocities is higher. Dashed lines are the linear regression for each data set.
