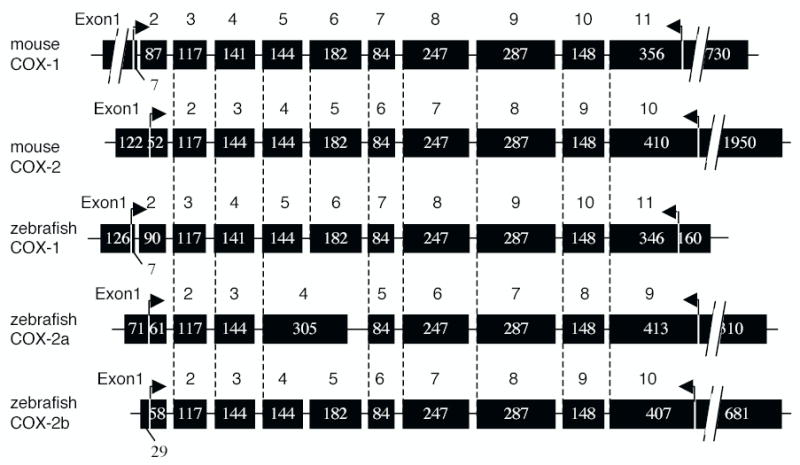
Figure 3.

Structures of the mouse and zebrafish Cox genes. The number and length of the exons of the zebrafish Cox-1, Cox-2a and Cox-2b genes are compared with exons of the mouse Cox-1 and Cox-2 genes. The numbers in the boxes indicate the numbers of nucleotides in each exon. The arrows above the genes indicate the coding regions.
