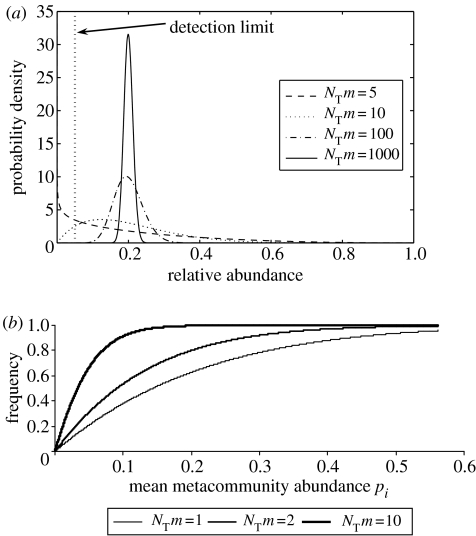
Figure 7.
How the value of NTm and m can be determined. (a) For a given mean source community abundance, the frequency with which an organism is observed is related to NTm, the total number of individuals multiplied by the immigration parameter. At high NTm values, the local distribution is tightly clustered around the mean meta-community distribution (in this case 0.2). As the NTm values drop, the distribution widens and eventually the mode of the curve falls below the detection limit and the organism is no longer observed. There is therefore a relationship between the mean source community abundance NTm and the frequency with which an organism is observed. (b) The expected frequency–relative abundance relationships observed in a local community for differing NTm values. Thus, for a given dataset, the NTm values can be found by fitting a line to these data; where the value of NT is known, m can be easily inferred.

