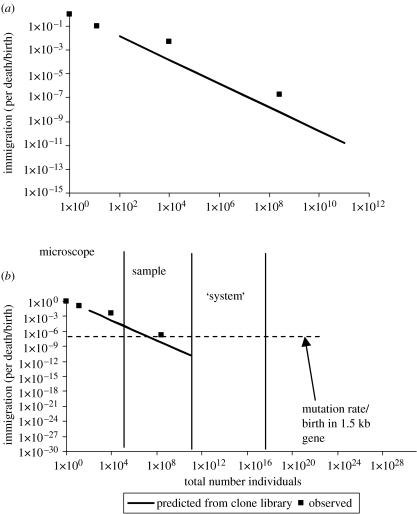
Figure 9.
The scaling of immigration with NT. From left to right are shown a single cell, through a clone library to a FISH study and a DGGE gel. The solid line is the scaling predicted within a system from the clone library data. The data is shown at (a) a local scale and (b) a global scale, there being approximately 1030 bacteria in the world. It is apparent that a plausible extrapolation of the observed data could bring the rate of immigration below a plausible rate of speciation. This would permit speciation in an open system.

