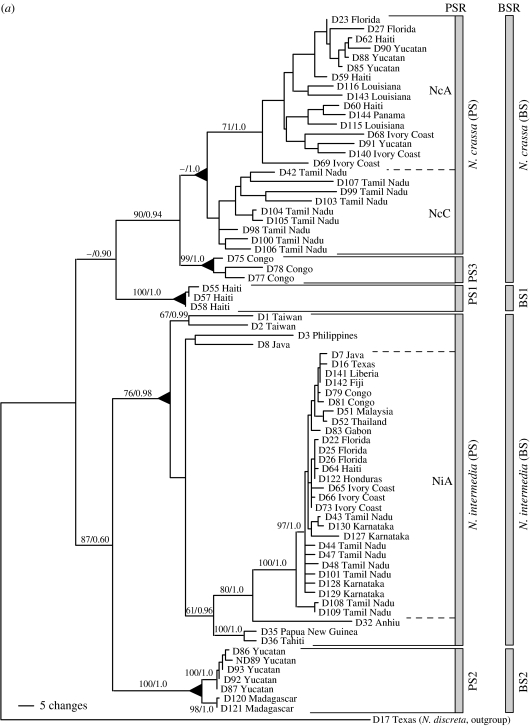
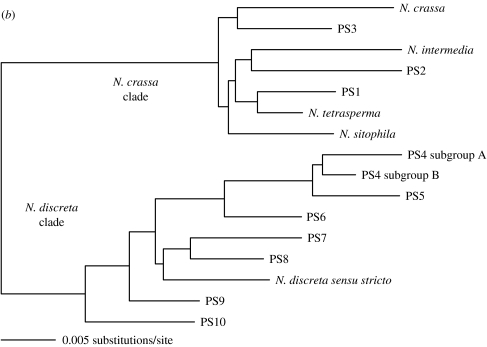
Figure 1.
(a) Phylogenetic species recognition applied to Neurospora and a graphic comparison to biological species recognition applied to the same individuals. Maximum-parsimony (MP) phylogram produced from the combined analysis of DNA sequences from four anonymous nuclear loci (TMI, DMG, TML and QMA loci, a total of 2141 aligned nucleotides). Tree length =916 steps; consistency index =0.651. Labels to the right of the phylogram indicate groups identified by phylogenetic species recognition and biological species recognition. Triangles at nodes indicate that all taxa united by (or distal to) a node belong to the same phylogenetic species. Taxon labels indicate strain number and geographic source. Branch support values for major branches with significant support are indicated by numbers above or below the branches (MP bootstrap proportions/Bayesian posterior probabilities). Figure and legend adapted from Dettman et al. (2003b) with permission of the authors and publisher. (b) Summary of results of phylogenetic species recognition in Neurospora. Neighbour-joining phylogram produced from three loci combined (DMG, TMI and TML) using exemplars of described species, and new phylogenetic species of Neurospora. Figure and legend adapted from Dettman et al. (in press) with permission of the authors and publisher.


