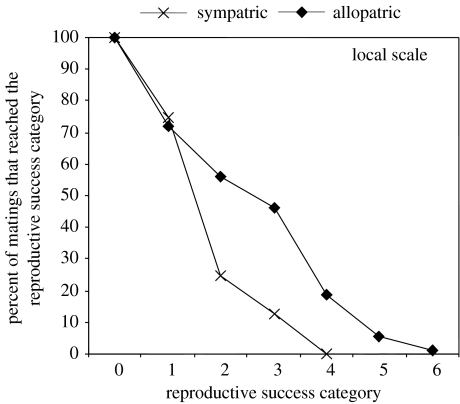
Figure 5.
Neurospora mating success for sympatric and allopatric heterospecific pairings: the percentage of heterospecific matings between allopatric or sympatric individuals that reached the successive categories of reproductive success. At all geographic scales (regional, sub-regional and local), allopatric matings were significantly more likely than sympatric matings to proceed through the consecutive stages of the sexual cycle. The discrepancy between the allopatric and sympatric curves increases as the scale of sympatry decreases and is most pronounced for local sympatry, shown here. Categories of reproductive success: 0, no response; 1, aborted perithecia; 2, perithecia with no ascospores ejected; 3, perithecia with less than 1% of ejected ascospores having strongly melanized (i.e. black) walls; 4, perithecia with less than 15% black ascospores; 5, perithecia with less than 50% black ascospores; 6, perithecia with more than 50% black ascospores. Figure and legend modified from Dettman et al. (2003b) with permission of the authors and publisher.

