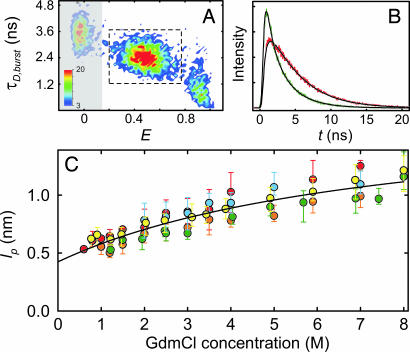
Fig. 4.
Fluorescence lifetime distribution analysis. (A) All events corresponding to unfolded molecules were selected (dashed box) from a two-dimensional histogram (shown is C2C67 at 1.5 M GdmCl) of the number of bursts (color scale) with transfer efficiency E and donor fluorescence lifetime τD,burst. (B) The photons were combined to generate time-correlated single-photon counting histograms for donor (green) and acceptor (red) (see SI Movie 2 for a complete data set of C2C67). (C) The rms end-to-end distance was determined and converted to the apparent persistence length lp (Eq. 4) by using a global fit assuming the distance distribution of a Gaussian chain (black lines). Error bars indicate the uncertainty in the fits. The solid black line in is a fit to all data as described in Fig. 3. The colors used correspond to those used in Fig. 1.

