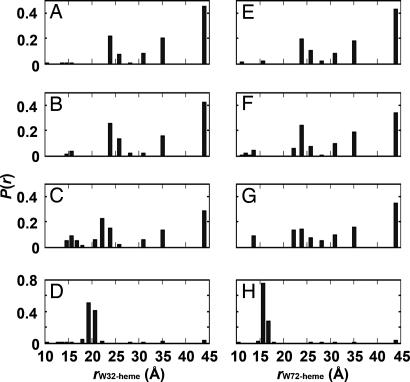
Fig. 2.
Probability distance distributions [P(r)] extracted from maximum entropy analyses of the FET kinetics data. Folding of cyt c′ was triggered by dilution of GuHCl in an ultrafast mixer (pH 7.0; 18°C; W32 [GuHCl] = 2.0–0.33 M; W72 [GuHCl] = 3.5–0.58 M). Only 4 of the 31 (W32, Left) or 52 (W72, Right) transient P(r) distributions are shown for clarity, corresponding to the unfolded state (A and E), folding times of 150 μs (B and F) and 2.5 ms (C and G), and the native state (D and H).

