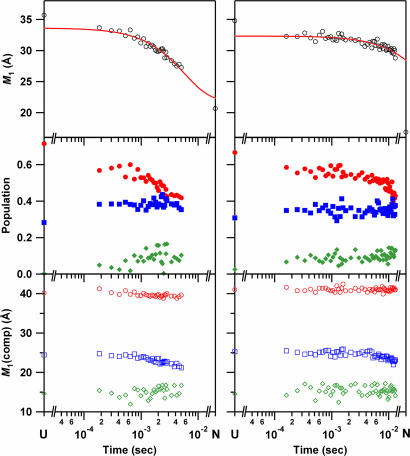
Fig. 3.
Folding kinetics of cyt c′ probed by W32 (Left) and W72 (Right) FET kinetics. (Top) Mean distance between tryptophan and heme, M1, as a function of refolding time. The solid line is a fit a single-exponential function: the rate constant for W32 is 1.7 × 10² s−1; that for W72 is 15 s−1 [determined by fixing infinite-time value to match that of the native state (16.9 Å)]. (Middle) Time course of the population of each component [●, extended conformers (>30 Å, E); ■, conformations with intermediate D–A distances (20 < r < 30 Å, M); and ◆, nonnative collapsed conformers (< 18 and 15 Å for W32 and W72, respectively, C)]. (Bottom) Time course of the average distance of each component (○, E; □, M; and ◇, C).

