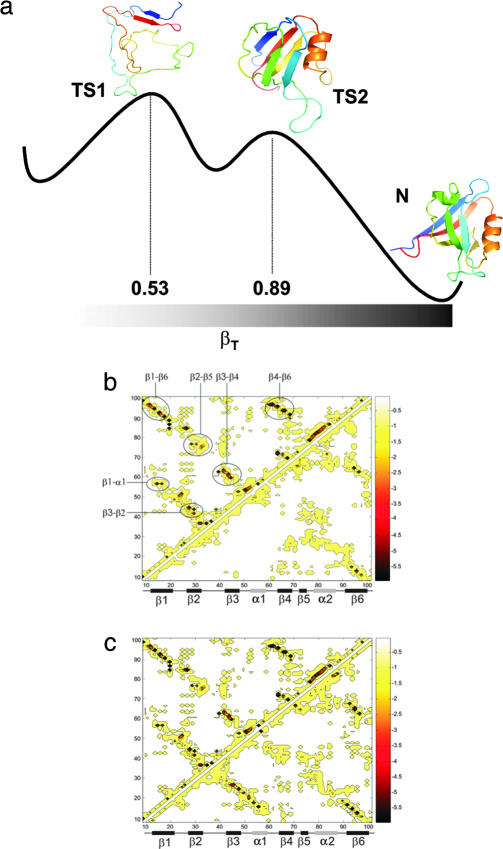
Fig. 1.
Schematic illustration of the free energy landscape for folding of PDZ2. (a) Schematic free energy landscape for the folding reaction of PDZ2. Representative structures of TS1 and TS2, chosen by the clustering procedure described in Materials and Methods, are reported together with the native state (Protein Data Bank ID code 1GM1). Structures are represented in rainbow colors from N-terminal (blue) to C-terminal (red) ends. (b and c) The energy map of the native state (above the diagonal) is compared with those (below the diagonal) of TS1 (b) and TS2 (c). The most favorable interactions between different regions of the native protein are indicated in b. This figure illustrates that the interactions β1–β6 and β4–β6 are already formed in TS1, and that additional interactions, in particular those between β1–α1 and between β2–β4 are formed in TS2. The secondary structure elements are: β1 (residues 11–20), β2 (residues 26–32), β3 (residues 41–48), α1 (residues 52–55), β4 (residues 63–69), β5 (residues 71–73), α2 (residues 79–86), and β6 (residues 90–99).

