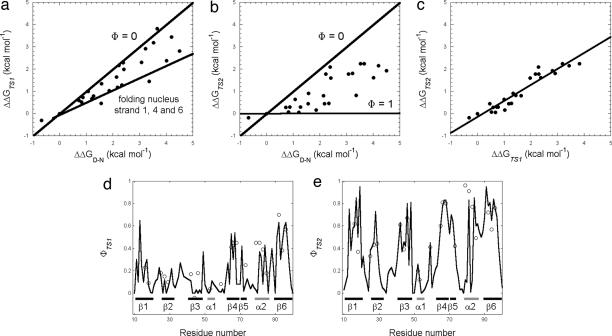
Fig. 3.
Relationships between the free energy differences of the different states along the folding pathway of the PDZ2 domain. Brønsted plots referring to the energy of TS1 (a) and TS2 (b) as a function of native state stability are shown. Lines reflecting denatured-like structure (Φ = 0), the weak folding nucleus (strands 1, 4, and 6) and native-like structure are reported. (c) Relationship between the stabilities of TS1 and TS2 in PDZ2 folding (ΔΔGTS1 vs. ΔΔGTS2); the line is the best fit to a linear function (R = 0.95). Φ-value profiles for TS1 (d) and TS2 (e): open circles represent experimentally determined Φ values, the black line indicates the calculated Φ values.

