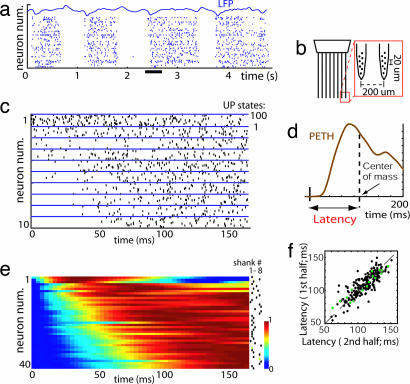
Fig. 1.
Sequential activity at UP state onset. (a) Spontaneous activity of neurons in S1 of a urethane anesthetized rat. DOWN states of complete silence alternate with UP states of generalized activity (underlined area is expanded in Fig. 3a). Neurons are arranged vertically by physical location of recording shank. (b) Schematic of silicon microelectrode used in these studies. (c) Raster plots for 10 example neurons triggered by UP state onset for 100 UP states, showing a diversity of temporal profiles. (d) Neural latency is defined as the center of mass of the PETH. (e) Pseudocolor plot showing normalized activity of a simultaneously recorded population triggered by UP state onset, vertically arranged by latency. The dots indicate at which shank neurons were recorded. (f) Neural latencies were stable, as illustrated by comparison of latencies calculated separately for the first and the second halves of data set (>30 min). Black and green dots represent putative pyramidal cells and interneurons, respectively.

