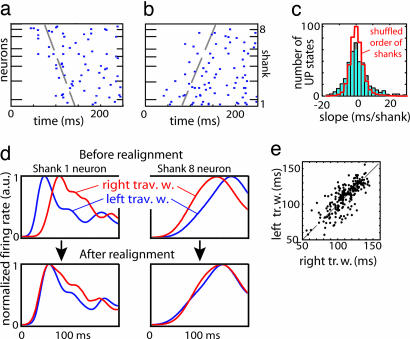
Fig. 3.
Interaction of traveling waves and local sequences. (a) Example of a traveling wave spreading from shank 8 to shank 1 under urethane anesthesia (expansion of underlined area in Fig. 1a). Neurons arranged vertically by recording shank location. Dashed line indicates propagation front fit by linear regression (see Materials and Methods). (b) Another traveling wave, propagating in the opposite direction, recorded during the same experiment. (c) Distribution of propagation front slopes. Red curve denotes distribution of slopes after shuffling shank order. (d Upper) PETHs computed separately for traveling waves moving to left (blue) and right (red), for two example neurons, aligned to global UP state onset defined by first spike time on any recording shank. (d Lower) PETHs realigned to shank-specific UP state onset times computed from propagation front slope, demonstrating increased stereotypy after realignment. (e) Scatter plot showing each neuron's latency for traveling waves moving to the left and right, computed from realigned PETHs. The strong correlation indicates that regardless of wave direction, neurons at a local site follow the same activation sequence.

