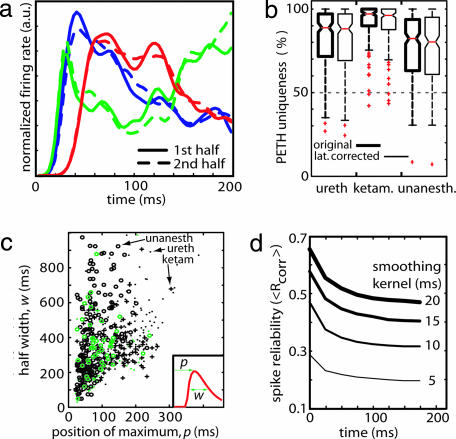
Fig. 4.
Uniqueness and precision of temporal profiles. (a) Normalized UP state triggered PETHs for three representative neurons estimated during the first (solid lines) and second halves (dashed lines) of a urethane experiment. Each neuron has a unique PETH shape that is consistent across the two halves of the experiment. (b) The difference between each neuron's PETH and the overall population was quantified with a “PETH uniqueness measure” (see Materials and Methods). PETHs are ≈90% unique for anesthetic and drug-free conditions. The distributions of this measure for the original data (thick lines) and after time-shifting by each neuron's mean latency (thin lines) were similar, indicating that uniqueness reflects PETH shapes, not just latency shifts. (c) Precision of neuronal firing decays as UP state progresses. PETH half-width w and peak position p were estimated from a gamma function fit (Inset); the graph shows the half-width and peak position for all neurons. Black or green symbols identify putative pyramidal cells or interneurons, respectively; symbol shape identifies anesthetic condition. Note that neurons with late onset latencies do not exhibit narrow half-width. (d) Spike timing reliability measure (Rcorr; see Results and SI Fig. 8) decays as a function of time after UP state onset. Line width indicates the size of smoothing kernel.

