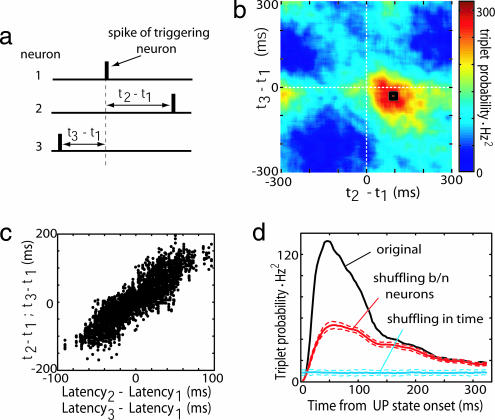
Fig. 5.
The structure of precisely repeating triplets is predicted by individual neural latencies. (a) For every trio of neurons, a spike triplet is described by two interspike intervals (t2 − t1 and t3 − t1). (b) Count matrix for a representative triplet of neurons, indicating the probability of different interspike interval combinations. Black square denotes triplets occurring within ± 10 ms of mode. (c) Triplet structure reflects individual neural latencies. Each triplet is represented by two points: (x1 = t2 − t1, y1 = latency2 − latency1) and (x2 = t3 − t1, y2 = latency3 − latency1). The strong correlation indicates that the structure of the triplets is predicted by the neurons' mean latencies to UP state onset. (d) Occurrence of precisely repeating triplets peaks shortly after the start of UP states. Blue and red curves denote shuffled data for independent Poisson and common excitability models, respectively (dashed lines indicate SD).

