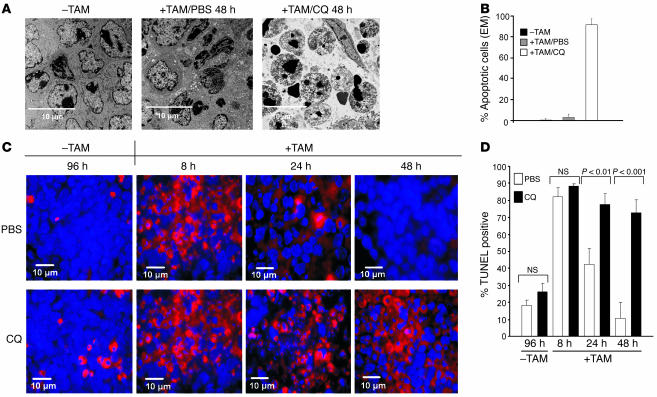
Figure 3. Effects of p53 activation with and without CQ on apoptosis.
(A) CQ-induced cell death after p53 activation. Electron micrographs of lymphoma tissues collected before TAM treatment and after 48 hours of TAM/PBS or TAM/CQ. Scale bars: 10 μm. Original magnification, ×4,000. (B) Quantification of tumor cells with morphological evidence of apoptosis. Electron microscopy (EM) was performed on Myc/p53ERTAM lymphomas at the indicated time points under the treatment protocols given. The percentage of apoptotic cells per field at ×4000 magnification was determined as described in Methods (mean ± SD). (C) TUNEL staining was performed on tissue obtained from treated tumors at the indicated time points. Representative images were obtained by fluorescent microscopy. Red fluorescence indicates TUNEL-positive cells. Blue fluorescence indicates nuclear DAPI staining. (D) Quantification of TUNEL-positive tumor cells. The percentage of TUNEL-positive cells per high-powered field is reported as mean ± SD.

