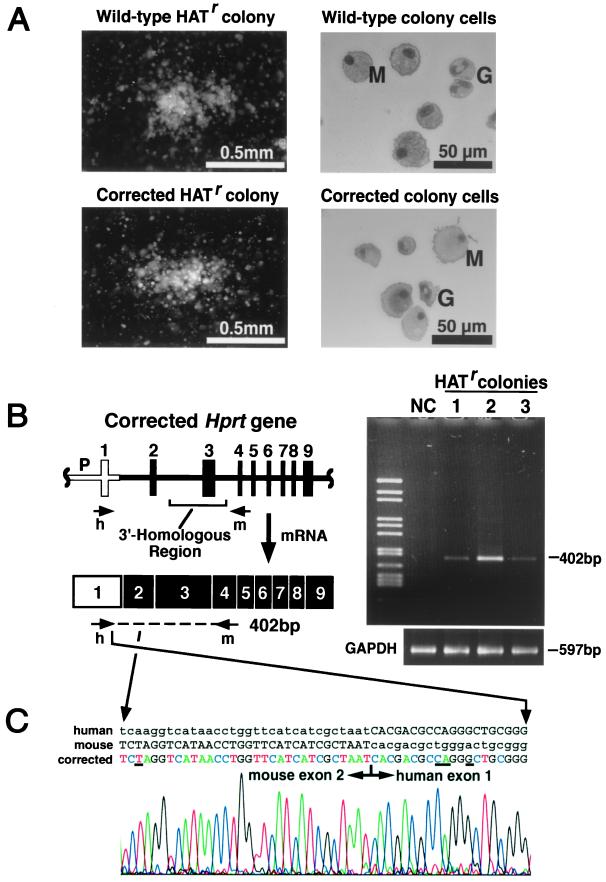
Figure 2.
Analyses of HATr colonies. (A) Typical HATr colonies (Left, dark field) and their component cells (Right, Wright–Giemsa-stained cytospin) from (Upper) wild-type BM cells mixed with Hprt− BM cells and (Lower) corrected Hprt− BM cells. M, macrophage; and G, granulocyte. (B) RT-PCR analyses to detect corrected Hprt transcripts. The diagram shows the corrected Hprt gene and the recombinant mRNA structure. The open box is human exon 1; the black boxes are mouse exons 2–9. The PCR analyses to test for gene targeting use a human-specific primer (h) from the first exon and a mouse primer (m) from the fourth exon. The photograph shows gel electrophoresis of the PCR products obtained when individual HATr colonies were analyzed by RT-PCR by using these primers. The 402-bp fragment was obtained with the HATr colonies (1, 2, and 3), which contain chimeric human-mouse transcripts from the corrected Hprt gene, but was not obtained with noncorrected (NC) cells. The same samples were tested with glyceraldehyde-3-phosphate dehydrogenase (GAPDH) primers which amplify a 597-bp fragment. (C) Nucleotide sequence of RT-PCR product from a HATr colony. The printed nucleotide sequences are from human HPRT cDNA (Top line), mouse cDNA (Middle line), and the 402-bp PCR product sequenced with a primer corresponding to mouse exon 4 (Bottom line). The gel scan from the automatic DNA sequencer is shown. The first exon of the PCR product is identical to the human HPRT sequence, and the second exon is identical to the mouse Hprt sequence. Capital letters highlight the first exon of human and second exon of the mouse. Underlining shows the differences between human and mouse.

