Abstract
Surgical articular cartilage repair therapies for cartilage defects such as osteochondral autograft transfer, autologous chondrocyte implantation (ACI) or matrix associated autologous chondrocyte transplantation (MACT) are becoming more common. MRI has become the method of choice for non-invasive follow-up of patients after cartilage repair surgery. It should be performed with cartilage sensitive sequences, including fat-suppressed proton density-weighted T2 fast spin-echo (PD/T2-FSE) and three-dimensional gradient-echo (3D GRE) sequences, which provide good signal-to-noise and contrast-to-noise ratios. A thorough magnetic resonance (MR)-based assessment of cartilage repair tissue includes evaluations of defect filling, the surface and structure of repair tissue, the signal intensity of repair tissue and the subchondral bone status. Furthermore, in osteochondral autografts surface congruity, osseous incorporation and the donor site should be assessed. High spatial resolution is mandatory and can be achieved either by using a surface coil with a 1.5-T scanner or with a knee coil at 3 T; it is particularly important for assessing graft morphology and integration. Moreover, MR imaging facilitates assessment of complications including periosteal hypertrophy, delamination, adhesions, surface incongruence and reactive changes such as effusions and synovitis. Ongoing developments include isotropic 3D sequences, for improved morphological analysis, and in vivo biochemical imaging such as dGEMRIC, T2 mapping and diffusion-weighted imaging, which make functional analysis of cartilage possible.
Keywords: MRI, Articular cartilage, Cartilage repair, Autologous osteochondral transplantation, Autologous chondrocyte implantation
Introduction
Articular cartilage injuries are one of the most common types of injuries seen in orthopaedic practice. In a retrospective review of 31,510 knee arthroscopies, the incidence of chondral lesions was 63% [1]. Full-thickness articular cartilage lesions with exposed bone were found in 20% of patients, with 5% of these occurring in patients less than 40 years old [1].
The treatment of articular cartilage damage remains a challenge because cartilage has a limited capacity for spontaneous repair after a traumatic insult or degenerative joint disease [2]. Joint surface defects that exceed a critical size heal poorly and usually lead to osteoarthritis. As a result, several therapeutic strategies have been developed to restore articular cartilage and produce a durable repair. These methods may be arthroscopic or open surgical techniques and include marrow-stimulation techniques, osteochondral grafting, and chondrocyte implantation technique [3, 4].
As the use of articular cartilage repair techniques has become more widespread, techniques for imaging articular cartilage have become increasingly important. Arthroscopy is unsuitable for routine follow-up due to its invasive nature and associated risks. Conventional radiography does not allow direct visualisation of cartilage and arthrography combined with conventional radiography or computer tomography only provides information related to the cartilage surface [5]. By contrast, through the use of appropriate magnetic resonance imaging (MRI) techniques it is possible to evaluate the biochemical and biomechanical status of cartilage in addition to cartilage morphology. These benefits make MRI a powerful tool for the initial diagnosis and subsequent post-operative monitoring of cartilage lesions and cartilage repair tissue.
Articular cartilage repair techniques
Marrow stimulation
There are several established marrow stimulation techniques, including abrasion arthroplasty, subchondral drilling and microfracture. The principle of marrow stimulation techniques is to abrade (abrasion arthroplasty) or pierce (drilling and microfracture) the subchondral bone at the base of the cartilage defect, causing controlled bleeding and clot formation in the cartilage defect, which leads to the subsequent formation of fibrocartilage. The newly formed fibrocartilage may fill the defect and give relief of symptoms, but it lacks the structural, biomechanical and biochemical properties to sustain normal joint function in the long term [6]. Therefore, there is an increasing interest in osteochondral autografts and autologous chondrocyte implantation (ACI) therapies.
Osteochondral grafting
Osteochondral autograft transplantation is currently considered as the only surgical technique that provides and retrains proper hyaline articular cartilage [7]. Cylinders of autologous bone with their associated overlying hyaline cartilage are harvested from relatively non-weight-bearing areas of the knee and transferred into similarly sized holes created within the articular defect to be treated [8]. This technique is used most frequently at the knee and ankle joints [9, 10]. The main clinical indications for autologous osteochondral transplantation are focal cartilage defects, osteochondritis dissecans and osteonecroses. Autologous osteochondral transplantation is recommended for cartilage defects up to 3–4 cm2 [8].
Autologous chondrocyte implantation (ACI)
ACI is currently considered the treatment of choice in young patients with a symptomatic full-thickness cartilage defect between 2 and 12 cm2 on the femoral condyle [11]. The classical ACI was first described in the mid-1990s and is a two-stage procedure. In the first stage, chondrocytes are harvested and cultured. In the second stage, a periosteal patch, usually harvested from the tibia, is sewn over the defect and the proliferated and differentiated cells are injected beneath the patch in order to fill the cartilage defect [12–14]. ACI provides significant and long-term benefits for patients in terms of diminished pain and improved function [15].
Most complications are directly related to the periosteal graft and a revision arthroscopy rate between 4.8% and 60% has been described due to the problems with the periosteal flap [15, 16]. Early problems (<6 months) include periosteal graft detachment and delamination, and the most common late complication is periosteal hypertrophy. Delamination has been reported in 14% of patients undergoing ACI [17, 18]. Periosteal hypertrophy, has been reported to cause symptoms in 10–26% of the cases [11, 15, 19, 20].
Matrix-associated ACT (MACT)
The necessity of a periosteal flap with classical ACI and the complications associated with this periosteal flap have led to the development of biomaterials as carrier for chondrocyte cells. The use of three-dimensional (3D) scaffolds has been shown to favour the maintenance of a chondrocyte-differentiated phenotype [21]. Thus efforts are now focused toward a tissue-engineering approach, which combines laboratory-grown cells with appropriate 3D biocompatible scaffolds.
Second generation ACI
The second generation of ACI technique use a bioengineered bi-layer collagen membrane rather than a periosteal flap [22, 23]. The use of a collagen membrane simplifies the surgical procedure and reduces overall surgical morbidity. Furthermore, the problem of periosteal hypertrophy can be avoided.
Third generation of ACI
Further technological advances have led to the third generation of ACI, which use biomaterials seeded with chondrocytes as carriers and scaffolds for cell growth. These “all-in-one” grafts do not need a periosteal cover or fixing stitches and can be trimmed to exactly fit the cartilage defect. The advantages of these new techniques are their technical simplicity, shorter operating time and the possibility to perform the surgery via a mini-arthrotomy or arthroscopy [23–26].
MR techniques for cartilage and cartilage repair imaging
Appropriate combinations of MRI techniques allow objective non-invasive measures of the properties of the grafted regions after biological cartilage repair, facilitating the longitudinal follow-up and evaluation of the repair tissue. MRI is currently the standard method for cartilage evaluation as it allows morphological assessment of the cartilage surface, thickness, volume and subchondral bone [27–33]. Additionally MRI techniques can be used to evaluate the biochemical and biomechanical status of articular cartilage. MRI is therefore ideal for the evaluation of the morphologic status of cartilage defects and the repair tissue throughout the post-operative period [34–37].
MR evaluation of cartilage repair can be performed using the same acquisition techniques as used for native cartilage, as recommended by the International Cartilage Repair Society [29, 35]. The most commonly used MRI techniques are intermediate-weighted fast spin-echo (FSE), and 3D fat-suppressed gradient-echo (GRE) acquisition [27–29, 31–35]. Fast spin-echo (FSE) imaging combines heavy T2 weighting, magnetization transfer effects and relative preservation of high signal intensity in the marrow fat, so that the subchondral bone exhibits high signal intensity. In FSE imaging, cartilage appears dark against bright synovial fluid and there is consecutive high contrast between joint fluid and cartilage, and cartilage and bone marrow [40]. Collagen fibres with a highly regular structure, in particular near the bone-cartilage interface, tend to immobilize water molecules and promote dipolar interactions between their protons, thus accelerating T2 relaxation. T2-weighted FSE sequences are therefore useful for both the detection of surface and matrix damage assessed by intrachondral signal abnormalities. Proton density-weighted T2 FSE is of intermediate signal adjacent to the low signal subcortical bony plate, which allows to better visualise intrachondral abnormalities and lesions near to the cortical bone; whereas with T2-weighted FSE cartilage has a low signal intensity, which gives a high contrast to bright synovial fluid, resulting in better delineation of cartilage surface defects. The T2-weighted FSE sequence is relatively insensitive to magnetic susceptibility artefacts, which is advantageous in patients who have undergone previous surgery of the joint. FSE sequences are advocated because of the possibility of acquiring high-resolution images in a relatively short scan time and are normally included in the standard MRI protocol for the knee joint for detection of meniscal and ligamentous lesions [28, 31]. An exciting new development is a 3D FSE sequence [sampling perfection with application optimised contrasts using different flip angle evolutions (SPACE)] with isotropic voxels, which allows multi-planar reformatting in any plane without loss of resolution.
The advantage of fat-suppressed 3D spoiled gradient echo sequences is the relatively high signal intensity of articular cartilage in contrast to low signal intensity from the adjacent fat-suppressed tissue. Three-dimensional acquisitions yield images with higher resolution and contrast-to-noise ratio than 2D acquisitions. Fat-suppressed, 3D spoiled gradient echo imaging is easy to perform, widely available and, contrary to other cartilage imaging techniques, such as magnetization transfer imaging, it requires no post-processing of data and avoids misregistration artefacts [27, 31–33, 35, 38]. The 3D data set can be reformatted in any plane, allowing 3D visualisation and volume measurements [27, 30, 39]. New isotropic 3D gradient echo sequences such as DESS (double-echo steady-state), true FISP (fast imaging in steady state precession), balanced FFE (fast field echo), VIBE (volume interpolated breath-hold examination) and MEDIC (multi-echo data image combination), with a voxel size down to 0.5 mm3, at 3 T, and also at 1.5 T with a high gradient strength, have been developed and seem to be very promising for cartilage imaging. However, the usefulness of these techniques is yet to be validated in clinical studies. Caution should be exercised as a flare phenomenon in the double-echo steady-state sequence has been shown to sometimes cause a spurious wavy appearance of a normal graft or cartilage surface [41, 42]. Furthermore, there are limitations in the sensitivity of the fast low angle shot (FLASH) and double-echo steady-state sequences for depicting cartilage abnormalities and opinions vary regarding which sequence is superior for cartilage imaging [42–44].
Indirect MR arthrography has been advocated in the evaluation of ACI [20, 29]. The indirect technique is performed by intravenous administration of contrast agent followed by a period of joint exercise, which leads to uptake of contrast agent by the synovial tissue and subsequent diffusion into the joint cavity. Indirect MR arthrography can be particularly helpful in differentiating delamination of the base of the graft from normal high signal intensity repair tissue in the immediate postoperative period [20, 29]. Thus, indirect MR arthrography may play a role in the evaluation of cartilage repair techniques in the early post-operative period.
Quantitative MRI of articular cartilage
Quantitative geometric measurements of cartilage parameters, such as cartilage thickness and volume, have been suggested as sensitive image based biomarkers for detecting and monitoring cartilage degeneration in osteoarthritis [45]. This has been possible due to the development of higher field magnets and stronger gradients systems as well as a parallel improvement in image analysis and processing techniques. New techniques allow rapid fully automated generation of accurate 3D reconstructions of articular cartilage layers [46]. Three-dimensional reconstructions can be generated from pre- and post-operative MR examinations and spatially registered to facilitate longitudinal comparisons of the cartilage repair site. This area holds a lot of promise for cartilage repair surgery planning; with on-going work to co-register biochemical and biomechanical sequences, such as dGEMRIC, with high-resolution 3D sequences.
High-resolution MRI
Most MRI studies on articular cartilage have tried to optimise pulse sequences that accentuate the contrast-to-noise ratio for cartilage, but less attention has been paid to image resolution.
Rubenstein et al. [47] demonstrated that the image resolution of standard MR sequences is insufficient to detect fraying of the articular surface of cartilage. It has also been reported that the smooth articular surface of healthy cartilage is indistinguishable from early superficial degenerative changes [27, 31–33]. Therefore, MRI of cartilage repair tissue must be performed at a sufficiently high resolution to detect early surface changes.
In order to obtain a sufficient resolution for cartilage repair imaging a 1.5-T MR scanner with a high performance gradient system and a dedicated extremity coil (quadrature/phased array coil) is a minimum requirement. Three-Tesla clinical MR systems are becoming more widespread and can generate images with both a high signal-to-noise ratio and a high resolution.
In our experience with cartilage repair patients, the signal-to-noise ratio issue arising with standard field MR units can be partially resolved by using surface coils and optimising the pulse sequence to increase resolution for a given imaging time. Surface coils provide a high signal-to-noise ratio allowing a small field of view and high matrix size to be used resulting in an in-plane resolution of 0.234 mm2 acquired in a clinically acceptable time. However, the use of a surface coil is limited to the evaluation of one knee compartment; since cartilage repair is usually restricted to one compartment, this rarely poses a problem.
Using this approach an appropriate assessment of the cartilage repair tissue can be made. Moreover, this approach formed the basis for the definition of pertinent variables for describing articular cartilage repair tissue following biological cartilage repair [48].
MR evaluation of the biochemical and biomechanical status of cartilage
Various tissue parameters which may be evaluated by MRI reflect the biomechanical properties of articular cartilage. The T1 and T2 relaxation times and apparent diffusion constants change during the cultivation of cartilage implants [49], indicating that the biomechanical properties of cartilage implants change as the graft matures. Furthermore, the spatial distribution of the T2 relaxation time can be used for in vivo monitoring of the biomechanical properties, pathological changes or aging of various cartilage layers [50, 51].
Glycosaminoglycans (GAG) are the main source of fixed charge density (FCD) in cartilage and changes in GAG concentration are one of the features of cartilage graft maturation. Intravenously administered gadolinium diethylenetriamine pentaacetate anion (Gd-DTPA2−), equilibrates in inverse relation to the FCD, which is in turn directly related to the GAG concentration. Therefore, T1 which is determined by the Gd-DTPA2− concentration becomes a specific measure of tissue GAG concentration. The delayed gadolinium-enhanced MRI of cartilage (dGEMRIC) technique can be considered the method of choice for visualisation and quantitative evaluation of proteoglycan in articular cartilage [52, 53]. The dGEMRIC technique is feasible at 3 T [54] and is useful for evaluating cartilage repair [55].
In vitro studies show that the dGEMRIC index has a good correlation with cartilage biochemical properties [56]. However, in vivo studies of the dGEMRIC index in ACI grafted tissue are not so clearly correlated with stiffness of the repair tissue. The differences are presumably due to differences in the collagen content and architecture of the repair tissue. Therefore, the both GAG (dGEMRIC) and collagen (T2 mapping) imaging techniques are required when evaluating the biomechanical status of cartilage repair tissue.
MR classification systems of cartilage implants
For the long-term follow-up, evaluation and classification of cartilage repair tissue clinical scores in addition to morphological and biochemical evaluation of biopsies taken during control arthroscopies have previously been used [37, 57].
For optimal use of MRI in the evaluation of cartilage repair tissue, a simple evaluation and a point scoring system that allows efficient statistical data analysis is necessary. A few different classification systems for the description of articular cartilage repair tissue have been proposed [37, 48] (personal correspondence with Dr C. Winalski, Brigham and Womens Hospital, Boston, Mass., USA); however, early systems have certain limitations and deficiencies that can potentially lead to confusion.
Roberts et al. [37] used four parameters to assess cartilage repair on MR images: surface integrity and contour, cartilage signal in graft region, cartilage thickness and changes in underlying bone. A score is obtained by summing the values of the four parameters; scores range from 0, no repair, to a maximum of 4, complete repair. Unfortunately the system only assesses each parameter as normal or abnormal and provides no assessment of the graft integration, degree of defect fill or the presence of adhesions.
The magnetic resonance observation of cartilage repair tissue (MOCART) scoring system, defined by our working group and shown in Table 1 [48], was designed to systematically record only those observations that can be most accurately and reproducibly determined and to avoid the use of ambiguous terms [48]. The MOCART system has been shown to be reliable and has excellent inter-observer reproducibility for the defined variables [58]. The system is very helpful for the longitudinal follow-up of cartilage repair patients [58], and facilitates prospective multi-centre studies comparing different cartilage repair techniques.
Table 1.
The MOCART scoring system
| Variable | Classes |
|---|---|
| Degree of defect repair and defect filling | Complete (on a level with adjacent cartilage) |
| Hypertrophy (over the level of the adjacent cartilage) | |
| Incomplete (under the level of the adjacent cartilage; underfilling) | |
| >50% of the adjacent cartilage | |
| <50% of the adjacent cartilage | |
| Subchondral bone exposed (complete delamination or dislocation and/or loose body) | |
| Integration to border zone | Complete (complete integration with adjacent cartilage) |
| Incomplete (incomplete integration with adjacent cartilage) | |
| demarcating border visible (split-like) | |
| Defect visible <50% of the length of the repair tissue | |
| >50% of the length of the repair tissue | |
| Surface of the repair tissue | Surface intact (lamina splendens intact) |
| Surface damaged (fibrillations, fissures and ulcerations) | |
| <50% of repair tissue depth | |
| >50% of repair tissue depth or total degeneration | |
| Structure of the repair tissue | Homogeneous |
| Inhomogeneous or cleft formation | |
| Signal intensity of the repair tissue | Dual T2-FSE |
| Isointense | |
| Moderately hyperintense | |
| Markedly hyperintense | |
| 3D GE-FS | |
| Isointense | |
| Moderately hypointense | |
| Markedly hypointense | |
| Subchondral lamina | Intact |
| Not intact | |
| Subchondral bone | Intact |
| Oedema, granulation tissue, cysts, sclerosis | |
| Adhesions | No |
| Yes | |
| Effusion | No effusion |
| Effusion |
MR findings following osteochondral autografting
Due to the invasive nature of arthroscopy, MRI has become the most important tool for the follow-up of patients with osteochondral autografts. There have been a limited number of studies focusing on the morphologic assessment of osteochondral grafts during clinical follow up. With the exception of the study by Link et al. [59], these studies have evaluated only relatively small numbers of patients [60, 61].
An MRI evaluation of osteochondral grafts should include: the number and size of the grafts; bone and cartilage integration, the cartilage surface contour; the contour of the cartilage bone interface; an assessment of the signal in the graft, the adjacent bone marrow and at the donor site; details of any soft tissue abnormalities and an assessment of the contrast enhancement patterns.
Cartilage and bone integration and congruity
When assessing integration and surface congruity following osteochondral grafting cartilage and bone should be considered separately. With respct to the cartilage, Link et al. [59] found only 15% of patients had an incongruity of the cartilage-cartilage interface. Furthermore, no substantial defects or irregularities of the cartilage overlying the bony cylinders were seen on MRI (Fig. 1). Lastly, gaps between cartilage plugs and between cartilage plugs and adjacent native cartilage were rarely visualised in this study [59] (Fig. 2).
Fig. 1.
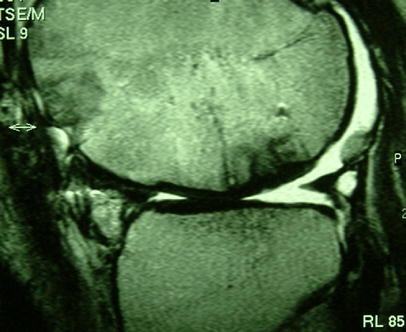
Normal cartilage integration of osteochondral autografts in the weight bearing region of the femoral condyle in a patient 2 years after osteochondral autografts
Fig. 2.
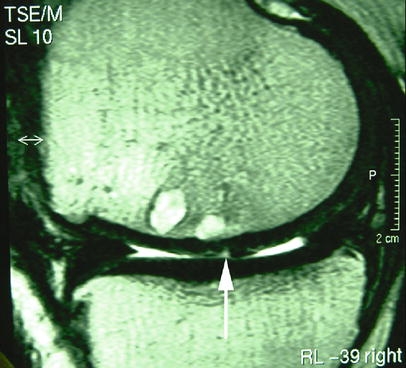
Cystic cavities in the osteochondral graft area with fissure-like gap (arrow) between cartilage caps of the grafts in a patient 2 years after osteochondral autografts. Both signs are associated with a poor prognosis
Sanders et al. [61] examined 21 patients between 1 and 22 months following osteochondral transplantation using a series of five dynamic contrast-enhanced sequences at 1-min intervals post contrast. Their findings were very similar to Link et al. [59] in terms of cartilage-cartilage interface incongruity.
In a study to evaluate the use of indirect MR arthrography in examinations of osteochondral graft patients Herber et al. [60] found that indirect MR arthrography helped to identify a persistent fissure gap between the implanted cartilage and native cartilage. They showed that the grafts were well seated and the cartilage-cartilage interface demonstrated a smooth contour in the majority of cases. Moreover, the authors felt that indirect MR arthrography was superior to unenhanced imaging in the assessment of the cartilage surface. Their results highlight a potential role for indirect MR arthrography in challenging cases.
Regarding the bony integration, Link et al. [59] reported that poor bony integration of the osteochondral cylinder may be suggested by the presence of cystic cavities with fluid-like signal intensity and/or a persistent oedema-like signal within the subchondral bone.
Cartilage and bone signal intensity
From 105 osteochondral cylinders in 55 patients (51%) Link et al. [59] reported bone marrow signal intensities consistent with oedema (hypointensity on T1-weighted images and hyperintensity on the fat-suppressed T2-weighted or PD-weighted images), during the first 12 months post-operatively (Fig. 3). During the 12–24 month period this dropped to 17%. They found cystic changes in the osseous component of the graft in four of 99 cylinders. Furthermore, eight cylinders showed no or partial enhancement after contrast agent was administered and was reported as necrosis. The T2 signal intensities varied depending on whether the osteonecrosis caused a fibro/sclerotic or cystic degeneration. This limits the usefulness of T2-weighted images for diagnosing graft osteonecrosis. Interestingly, only two of the six patients who showed signs of osteonecrosis of one or more cylinders had associated clinical abnormalities [59]. These osteonecroses of the graft cylinders did not lead to collapse of the bone or pathological changes of the cartilage that could be visualised by the MRI. Since cartilage derives its nutrition almost exclusively from the synovial membrane, this may provide an explanation. By comparison, Sanders et al. [61] and Hangody and Fules [9] reported no cases of osteochondral necrosis in their patient groups.
Fig. 3.
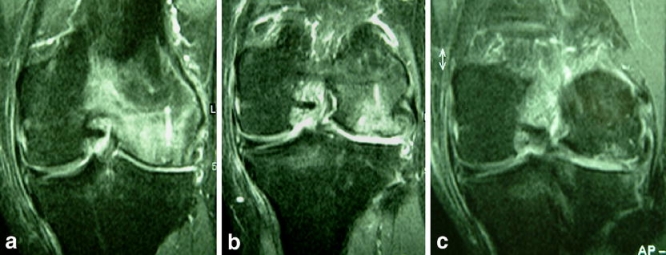
Coronal STIR images 12 weeks (a), 52 weeks (b) and 2 years (c) after osteochondral transplantation show gradual resolution of severe bone marrow oedema in and around the grafts as bony incorporation occurs
When the cartilage layer of the osteochondral cylinder was examined, the cartilage signal intensity of the graft was similar to the surrounding cartilage in the vast majority of cases, 86% [59]. These findings are supported by Sanders et al. [61], who found that the graft cartilage signal intensity was similar to adjacent cartilage in most cases. Additionally they found similar rates of graft and perifocal graft oedema.
Graft and adjacent bone
Subchondral bone marrow oedema is often present in the early post-operative phase but usually resolves as the graft incorporates into the subchondral bone. A normal fatty marrow signal is seen within and around the plugs when solid bony incorporation occurs (Fig. 4). Herber et al. [60] examined ten patients at 3, 6 and 12 months using indirect MR arthrography and noted a high rate of early post-operative subchondral marrow oedema, which settled in most cases by 12 months.
Fig. 4a, b.
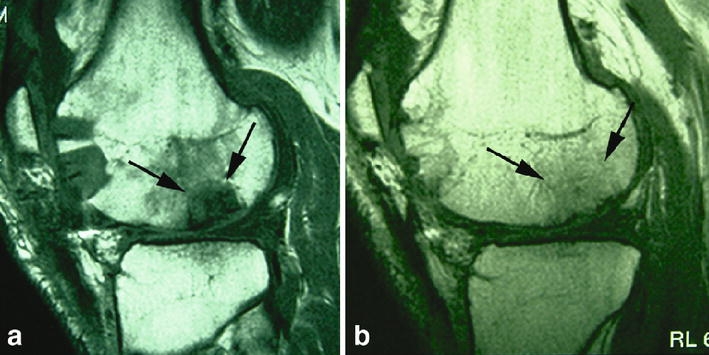
Sagittal T1-weighted SE images of the normal development of autologous osteochondral transplants. a Marked oedema in and around the osteochondral plugs at the recipient site 12 weeks (arrows) after surgery and b bony incorporation of the grafts with fatty bone marrow in and around the grafts (arrows) and filling of the donor site with cancellous bone after 2 years
Normal findings
The results of these earlier follow-up studies have helped to define normal and abnormal MR findings following osteochondral autografting and help in the identification of possible complications.
“Normal” MR findings associated with after osteochondral autografting include bone marrow oedema in and around the grafts in approximately 50% of the subjects during the first 12 months, with a gradual reduction thereafter. However persistent oedema may be seen in a small number of cases for up to 3 years post-operatively. Joint effusion and synovitis appear to follow a similar trend. Incongruities at the bone-bone interface occur frequently, while incongruities at the cartilage-cartilage interface occur in approximately 15% of grafts. The sometimes substantial incongruities of the bone-bone interface should not be interpreted as an abnormal finding or complication. Differences occur because the cartilage thickness of the donor site commonly differs in thickness from the implant site, but the cylinder is inserted to a depth to ensure a smooth cartilage surface.
Abnormal findings
Complications which can be determined by MRI include graft loosening or migration, incongruencies of the cartilage-cartilage interface, significant gaps between osteochondral plugs and adjacent native cartilage and partial or complete necroses of the grafts (Figs. 5, 6). However, it should be noted that over time fibrocartilagenous tissue fills the gaps between osteochondral plugs and adjacent native cartilage thereby improving surface congruity.
Fig. 5.
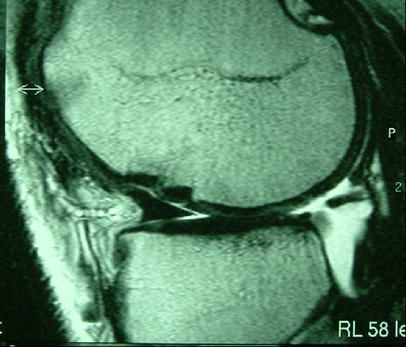
Incongruity at the cartilage-cartilage interface on a medial femoral condyle 12 months after osteochondral autografting
Fig. 6.
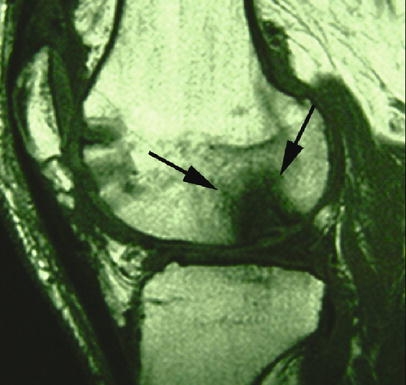
Osteonecrosis of the osteochondral autograft 2 years after surgery shown by marked hypointense signal alteration of the graft on T1-weighted SE image in the sagittal plane (arrows)
Future studies in this field should provide better understanding of the pathophysiology of transplanted hyaline cartilage and its function, which is important for the long-term prognosis of these patients.
MR findings following ACI and MACT
Assessment and interpretation of MR examinations for ACI and MACT patients should be performed in a systematic fashion. Careful attention should be paid to the degree of defect filling, the integration of the graft to adjacent cartilage and underlying bone, the graft’s internal structure and surface, its signal intensity and any changes in the subchondral bone. Last but not least, the presence of adhesions to the graft or joint effusion should be evaluated.
Defect filling
One of the major goals of ACI and MACT is to ensure the graft cartilage has the same thickness as the adjacent native cartilage in order to restore the smooth contour of the articular cartilage surface (Fig. 7). When evaluating defect fill MRI has been shown to be effective in detecting cases of incomplete filling, either focally or globally [20, 29, 34, 36].
Fig. 7.
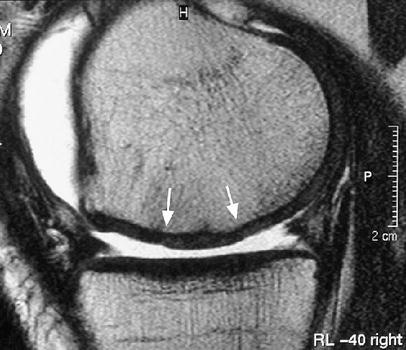
A sagittal FSE image of a stable cartilage implant at 2 years after MACT surgery shows complete filling of the defect (arrows mark the borders of the implant)
Longitudinal MRI follow-up of ACI patients has shown that a consistent volume of repair tissue can be visualised after 3 months, which remains stable for at least 2 years post-operatively [62]. Tins et al. [63] demonstrated that 63% of patients in their series had normal cartilage thickness compared with native articular cartilage. Roberts et al. [37] also found a similar percentage of grafts to have normal cartilage thickness compared with adjacent native cartilage. In a different study with a 2-year MR follow-up [64], complete filling of the defect by repair tissue was seen in 65.2% of patients.
Graft hypertrophy is often asymptomatic, but may produce pain and catching. It usually occurs between 3 and 7 months and has been reported to complicate between 10% and 39% of cases [15, 18, 65]. Graft hypertrophy is seen on MRI as the ACI graft protruding above the level of the native articular cartilage and may involve part or the full width of the graft (Fig. 8). It is important to note that hypertrophy of grafts close to the intercondylar notch may cause impingement on the anterior cruciate ligament. Treatment consists of arthroscopic debridement of the hypertrophied tissue.
Fig. 8.
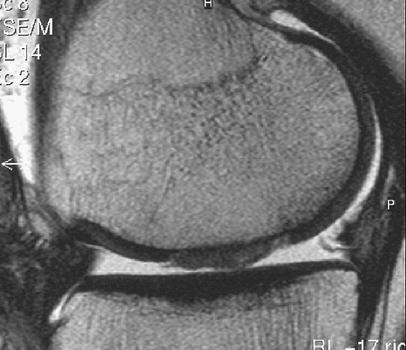
Severe hypertrophy of cartilage implant 104 weeks after MACT surgery on a sagittal T2-weighted FSE image
The reported incidence of graft hypertrophy following MACT is lower than with the classical ACI with periosteal flap technique [22, 66]. We found an incidence of 20% graft hypertrophy following MACT surgery [64], which is similar to the hypertrophy rate following classical ACI surgery [18, 67]. Interestingly, however, in three out of four cases the graft hypertrophy resolved, with the cartilage thickness returning to the level of adjacent cartilage within one year. This was hypothesised to be due to increasing weight bearing during rehabilitation and subsequent remodelling of the repair site.
Henderson et al. [19] analysed 81 lesions in 58 knees 12 months after ACI and reported that MRI showed 81.6% of the lesions had normal or nearly normal cartilage at the site of repair. These investigators analysed four categories, including the filling and the signal intensity of the repair site, as well as the presence and severity of bone-marrow oedema and effusion. A complete fill of the repair site was found in 79%, 13.6% had >50% filling, and 2.5% had <50% filling. By comparison, we found filling to the level of adjacent cartilage in 65.2% and underfilling in 17.4% in a 2-year follow-up of MACT patients using Hyalograft C [64].
Integration
The interface between ACI and native cartilage should be indiscernible, a fluid-like split, in particular a broad split or one that extends beneath the base of the ACI has been described as pathological [20, 34, 36] (Fig. 9). Poor graft integration can be identified on high-resolution sequences by fluid signal clefts or ill-defined high signal intensity at the interface between the graft tissue and native cartilage [15, 18, 20, 34, 36, 67].
Fig. 9.
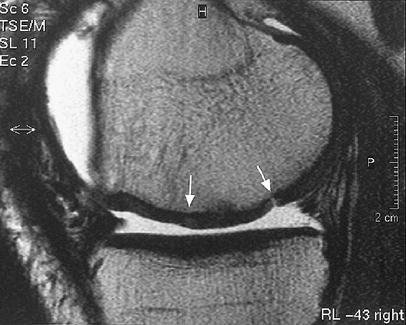
A split-like integration defect, seen on a sagittal FSE image, 52 weeks after surgery. Arrows mark the borders of the implant, the right-hand arrow points to the defect
The clinical importance of a full-thickness fissure or a broader gap, suggesting incomplete integration, is still unclear. Potentially, a gap between the native cartilage and the edge of the graft may act as a focal point for cartilage wear [36]. We found integration to be complete in 18 out of 23 knees after 2 years [64]. One patient had incomplete integration with a split-like fissure between the graft and adjacent cartilage. Four patients showed incomplete integration with a slightly broader gap between the graft and adjacent cartilage (17.4%).
Poor integration of the ACI repair tissue to the bone or to the adjacent native cartilage may result in delamination of the graft from the underlying bone (Fig. 10). On MRI, a delaminated graft may appear as a loose body in the joint if it has dislocated, or if still in situ at the repair site, a thin rim of fluid between the base of the graft and the subchondral bone plate, resembling a cartilage flap, may be seen [20, 34]. Clinically, patients may complain of pain, swelling or locking. This complication may occur in between 5% and 14% of cases [15, 18].
Fig. 10.
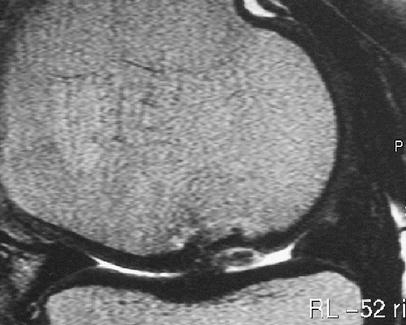
A sagittal FSE image of incomplete delamination of the repair tissue 24 weeks after MACT surgery. Fluid partially demarcates the bone interface
Structure and surface
The articular surface of the ACI or MACT site should appear smooth and be continuous with the adjacent native cartilage. Irregularities of the graft surface on MRI have been described previously and seem to be relatively common [19, 20, 34, 68, 69]. This is in keeping with findings during follow-up arthroscopy [70].
In some patients, we have seen a transition from an initially irregular surface to a regular smooth surface over time (Fig. 11). We believe this may represent continuous organisation of the graft as it matures. In contrast, the development of surface defects over time should be considered as abnormal [62].
Fig. 11.
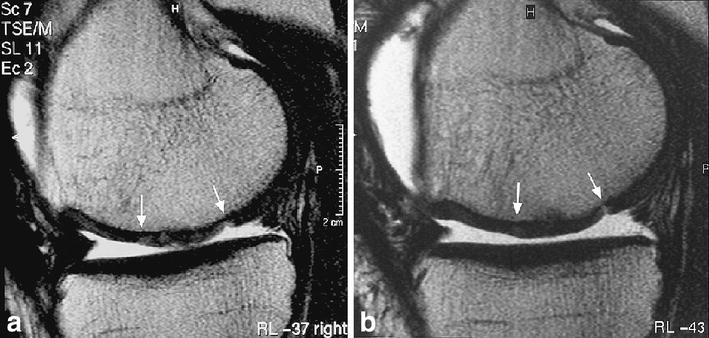
Gradual integration and normalisation of the graft surface and internal structure after MACT surgery from (a) 12 weeks to (b) 24 weeks on sagittal T2-FSE image
The internal structure of normal hyaline cartilage usually has a trilaminar appearance on most sequences [71]. Although the widths of these signal bands seen on MRI did not correlate with the thickness of histological layers and were affected by chemical shift and the magic angle effect, they represent a homogeneous layering present in normal collagen architecture. Regarding the internal structure of the graft we found only eight out of 23 patients had homogeneous repair tissue at their first follow-up scan. In a further eight patients the repair became homogeneous with signal layering during the follow-up period [62]. This most likely represents a normal maturation process, whereas the reverse process with repair tissue going from a homogeneous to inhomogeneous appearance over time may be considered abnormal.
Signal intensity
In addition to a smooth surface and homogeneous signal layering, the signal intensity of repair tissue should resemble normal hyaline cartilage. The post-operative signal characteristics seen after ACI surgery are clearly affected by the choice of sequence used. In the uncomplicated case, there is a gradual change in the signal characteristics of the repair tissue over time to resemble those of normal articular cartilage [62, 72] (Fig. 12). Typically, when a FSE sequence is used the signal intensity of the ACI/MACT repair tissue steadily decreases with time. By contrast the signal intensity steadily increases over time with fat-suppressed T1-weighted GRE sequences [19, 62, 65].
Fig. 12a–e.
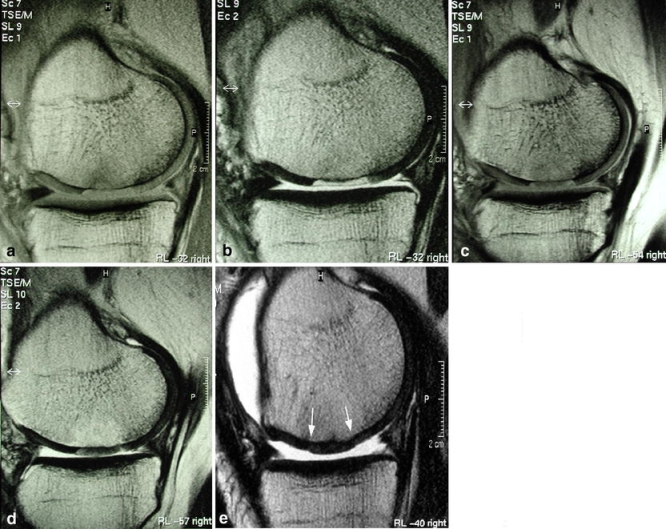
Changes of implant signal intensity, on PD and T2-FSE images following MACT. a, b Fluid-like signal after 4 weeks; c, d hypointensity at 24 weeks and e isointensity with native hyaline cartilage after 52 weeks
In the early post-operative period (4 weeks) the graft may have a fluid-like appearance, which may be misinterpreted as complete delamination. However, on high-resolution imaging the surface of the implant is seen as a thin dark line, this feature is more commonly seen with classical ACI [34]. Several report show that at approximately 12 months post-operatively the signal intensity of the ACI graft on both FSE and fat-suppressed GRE sequences resembles native hyaline cartilage and can no longer be differentiated from it [19, 20, 34, 68, 69]. By contrast, Brown et al. [17] found that a significant proportion of grafts (69%) remained hyperintense on FSE sequences more than 18 months after surgery.
In clinical follow-up studies, Henderson et al. [19] reported signals identical to the adjacent articular cartilage in 63% of patients following classical ACI grafting and nearly normal signals in 29.6% at 12 months. In our group of MACT patients, we found all grafts evaluated at 24 months were isointense [64]. These differences may be attributable to the different evaluation times and the further maturation of the graft over the additional 12-month period in our study.
Subchondral lamina and bone
The subchondral lamina is normally not violated during the ACI or MACT procedure and therefore should be intact. However, cartilage repair for cases of osteochondritis dissecans or involving partial removal of subchondral sclerosis may be associated with defects of the cortical endplate. An intact cortical endplate which becomes damaged during follow-up may be the result of over-use or recurrent trauma [62]. The bone contour underneath the graft may show the presence of central osteophytes, defects, and irregularities. When central osteophyte formation occurs beneath a graft the surface of the overlying cartilage is usually smooth and level with adjacent cartilage. The importance of central osteophytes has still to be determined [63].
Subchondral oedema commonly occurs at the repair site in the early postoperative period [17, 19, 29, 34, 63, 68], and has been described as part of the normal healing process during the first 3 months following surgery [20, 34]. Abnormal loads transmitted to the bone have also been suggested to account for the marrow oedema [73]. The presence of oedema-like marrow signal beyond 12 months or an increase in intensity of oedema should be considered abnormal and requires close clinical follow-up [20, 34]. Possible reasons for persistent or reappearing subchondral bone marrow oedema include: over-use, an abnormality of the leg axis and new trauma. Conversely, it has been reported that the persistence of oedema-like signal intensity is a sign of yet undetermined importance [34]. For the diagnosis of bone marrow oedema, a fat-suppressed sequence such as STIR or fat-suppressed FSE is required. Cystic changes in the subchondral bone underneath the cartilage implant have been described and indicate a problem with the graft which requires close clinical follow-up [19]. Cyst formation has been associated with oedema-like signal intensity in 10% of cases with these cases also demonstrating a fibrocartilage appearance rather than hyaline-like articular cartilage [63]. In our series of 23 patients who underwent MACT surgery, we found 13% had an oedema-like signal in the subchondral bone at 2 years [64].
A comparison of ACI and MACT patient groups [19, 64] showed the rate of bone marrow oedema and effusion was similar, approximately 40%, with both techniques.
Adhesions
Adhesions are demonstrated on MRI as bands of intermediate to low signal intensity tissue traversing the joint and demonstrating contact to the repair tissue (Fig. 13). Adhesions most commonly connect to the infra-patellar fat pad, suprapatellar pouch and parapatellar recesses [15, 18, 67]. Knee stiffness from intraarticular adhesions requiring arthroscopic release has been reported in up to 10% of ACI patients [15, 67, 73]. Patients who have undergone extensive cartilage repair or have multiple grafts appear to be more at risk [18]. Adhesion to the graft surface may lead to graft tearing or dislocation as the patients activity level increases.
Fig. 13.
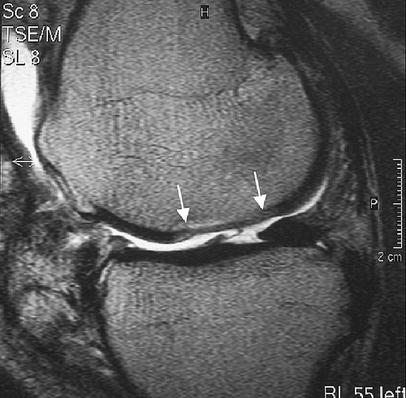
An adhesion seen as a thin band-like structure, running from the tibial articular surface to the cartilage implant on a sagittal T2-FSE image. Arrows mark the borders of the implant
Effusion
Post-operative reactive synovitis should be considered as a possible cause of pain in this patient group. For the evaluation of synovitis intravenous contrast media application is usually required. Synovitis is generally accompanied by effusion and clinical signs of swelling of the affected joint. The majority of cases with synovitis in the early postoperative period resolved during the follow-up, which can be explained by its reactive nature [64]. In addition to the cartilage repair surgery itself other causes of synovitis have to be considered, such as native cartilage defects or meniscal lesions.
Maturation of cartilage repair tissue
Serial follow-up MRI scans of MACT patients show that the cartilage repair is a dynamic process that can be non-invasively monitored [62]. High-resolution MRI examinations at 4, 12, 24, 52 and 104 weeks post-operatively revealed characteristic changes in the repair tissue over time, which we believe represent the normal maturation process of the repair tissue. The most significant features were: first, early filling defects showed progressive filling by 6–12 months (Fig. 14); second, initial graft hypertrophy seen at 3 months resolved by 6 months; third, small surface defects became smooth over time. Finally, signal intensity gradually changes over time from fluid-like appearance in the early post-operative stage to iso-intensity with surrounding native hyaline cartilage by 6–12 months. One may conclude that inverse developments are associated with a poor prognosis.
Fig. 14a, b.
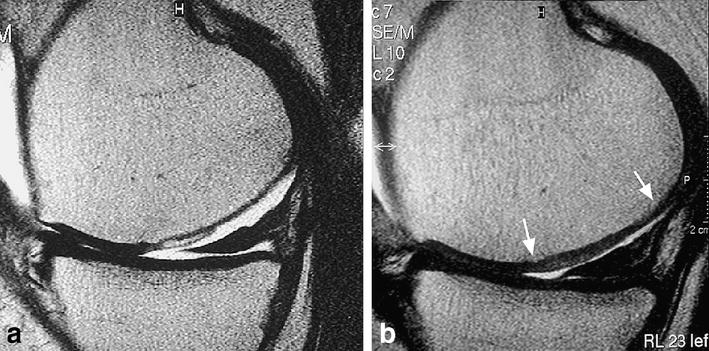
Progressive defect filling at the repair site. After matrix-based autologous chondrocyte implantation, significant improvement of filling of the defect at the repair site from (a) 4 weeks to (b) 24 weeks post-operatively, depicted on sagittal FSE images
Histology
In a histological analysis of follow-up biopsies after ACI surgery, 57% of patients after ACI demonstrated articular cartilage [74]. However, it is generally hypothesised that continuous remodelling of the graft occurs with the transplant becoming more like hyaline cartilage.
To our knowledge only one study has attempted to correlate MRI findings with ACI graft histological findings [63]. Tins et al. [63] studied 41 patients at 1 year following ACI grafting on the femoral condyle. The histological appearance of the graft was classified into one of the four morphological categories recommended by the ICRS. MRI findings were correlated to the histology findings. The authors found no relationship between any of the MRI features assessed and the histological appearance of the cartilage repair tissue; however, this is unsurprising given the sequences used. Studies of the correlation between histology and the dGEMRIC index and/or T2 maps are a very interesting area for future studies.
Functional outcome
Marlovits et al. [58] recently described the statistical correlation of clinical outcome scores with the radiological variables of the MOCART scoring system. For the variable “filling of the defect” a statistically significant correlation with all KOOS (knee injury and osteoarthritis outcome score) variables and also with the VAS (visual analogue score) was observed. For the variable “integration to border zone” and “surface of the repair tissue” no statistically significant correlation was found. The variable “structure of the repair tissue” showed a statistically significant correlation with the VAS and nearly all KOOS group except for the variable “symptoms”. For the variables “adhesion”, “subchondral lamina”, and “effusion” no statistically significant correlation with the clinical scores was found. In contrast the variable “subchondral bone” showed a statistically significant correlation with the VAS and nearly all KOOS group except for the variable “symptoms”. For the signal intensities a statistically significant correlation was found with the KOOS variables “symptoms”, “sport”, and Activities of daily Living (ADL) function.
Recommendations
From reviewing our studies and those of other centres we recommend that follow-up MR studies should be performed at 3 months and 1 year. The initial imaging at 3 months allows the volume and adherence of repair tissue to be assessed. Imaging at 1 year demonstrates the maturation of the graft and allows complications to be identified both non-invasively and at a sufficiently early stage.
Conclusion
In the near future as the use of clinical high-field (3 Tesla) systems with modern multi-element coil configurations becomes more widespread and new high-resolution isotropic 3D sequences are utilised a further improvement in the morphological analysis of cartilage implants can be expected. Moreover, advanced cartilage imaging techniques which allow the biochemical composition of cartilage to be studied will be possible in vivo (Fig. 15). This is particularly promising for evaluating the maturation of the graft and whether or not hyaline cartilage has developed. The ability to non-invasively assess graft maturity will help to define the optimal postoperative rehabilitation and to detect the early stages of graft failure.
Fig. 15a, b.
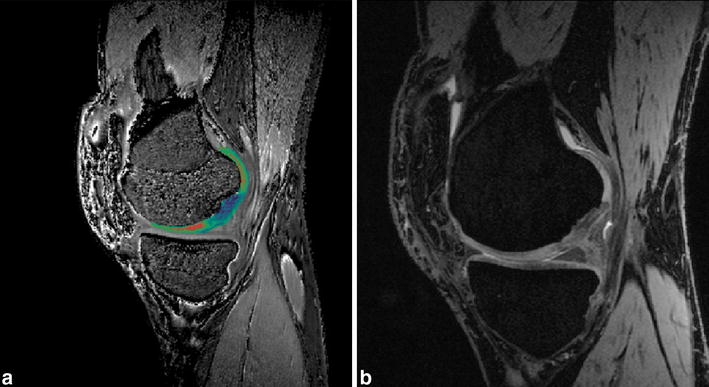
A dGEMRIC image of a matrix-associated ACT 2 years after surgery. a The cartilage layer of the graft shows different T1 values, representing proteoglycan concentration, compared with hyaline cartilage. b a 3D-GRE image of the same patient, which shows morphology of cartilage implant with hypointense signal alteration of the cartilage implant in comparison with normal hyaline cartilage
Acknowledgements
The authors would like to express their thanks to Siemens Medical Solutions, Erlangen, for access to new 3D sequences described.
References
- 1.Curl WW, Krome J, Gordon ES et al (1997) Cartilage injuries: a review of 31,516 knee arthroscopies. Arthroscopy 13:456–460 [DOI] [PubMed]
- 2.Buckwalter JA, Mankin HJ (1997) Articular cartilage. 2. Degeneration and osteoarthrosis, repair, regeneration, and transplantation. J Bone Joint Surg Am 79A:612–632
- 3.Minas T, Nehrer S (1997) Current concepts in the treatment of articular cartilage defects. Orthopedics 20:525–538 [DOI] [PubMed]
- 4.Hunziker EB (2002) Articular cartilage repair: basic science and clinical progress. A review of the current status and prospects. Osteoarthr Cartil 10:432–463 [DOI] [PubMed]
- 5.Waldt S et al (2005) Comparison of multislice CT arthrography and MR arthrography for the detection of articular cartilage lesions of the elbow. Eur Radiol 15:784–791, Apr [DOI] [PubMed]
- 6.Gilbert JE (1998) Current treatment options for the restoration of articular cartilage. Am J Knee Surg 11:42–46 [PubMed]
- 7.Ueblacker P, Burkart A, Imhoff AB (2004) Retrograde cartilage transplantation on the proximal and distal tibia. Arthroscopy 20:73–78 [DOI] [PubMed]
- 8.Hangody L, Rathonyi GK, Duska Z et al (2004) Autologous osteochondral mosaicplasty. Surgical technique. J Bone Joint Surg Am 86–A(Suppl 1):65–72 [PubMed]
- 9.Hangody L, Fules P (2003) Autologous osteochondral mosaicplasty for the treatment of full-thickness defects of weight-bearing joints: ten years of experimental and clinical experience. J Bone Joint Surg Am 85–A(Suppl 2):25–32 [DOI] [PubMed]
- 10.Hangody L, Feczko P, Bartha L et al (2001) Mosaicplasty for the treatment of articular defects of the knee and ankle. Clin Orthop Relat Res (391 Suppl):S328–S336 [DOI] [PubMed]
- 11.Minas T, Chiu R (2000) Autologous chondrocyte implantation. Am J Knee Surg 13:41–50 [PubMed]
- 12.Brittberg M (1999) Autologous chondrocyte transplantation. Clin Orthop Relat Res (367 Suppl):S147–S155 [DOI] [PubMed]
- 13.Brittberg M, Lindahl A, Nilsson A et al (1994) Treatment of deep cartilage defects in the knee with autologous chondrocyte transplantation. N Engl J Med 331:889–895, 6–10 [DOI] [PubMed]
- 14.Brittberg M, Tallheden T, Sjogren-Jansson B et al (2001) Autologous chondrocytes used for articular cartilage repair: an update. Clin Orthop Relat Res (391 Suppl):S337–S348 [DOI] [PubMed]
- 15.Peterson L, Minas T, Brittberg M et al (2000) Two- to 9-year outcome after autologous chondrocyte transplantation of the knee. Clin Orthop Relat Res (374):212–234 [DOI] [PubMed]
- 16.Erggelet C, Browne JE, Fu F et al (2000) Autologous chondrocyte transplantation for treatment of cartilage defects of the knee joint. Clinical results. Zentralbl Chir 125:516–522 [PubMed]
- 17.Brown WE, Potter HG, Marx RG et al (2004) Magnetic resonance imaging appearance of cartilage repair in the knee. Clin Orthop Relat Res (422):214–223 [DOI] [PubMed]
- 18.Minas T, Peterson L (1999) Advanced techniques in autologous chondrocyte transplantation. Clin Sports Med 18:13–44, v-vi [DOI] [PubMed]
- 19.Henderson IJ, Tuy B, Connell D et al (2003) Prospective clinical study of autologous chondrocyte implantation and correlation with MRI at three and 12 months. J Bone Joint Surg Br 85:1060–1066 [DOI] [PubMed]
- 20.Alparslan L, Winalski CS, Boutin RD et al (2001) Postoperative magnetic resonance imaging of articular cartilage repair. Semin Musculoskelet Radiol 5:345–363 [DOI] [PubMed]
- 21.Grigolo B, Lisignoli G, Piacentini A et al (2002) Evidence for redifferentiation of human chondrocytes grown on a hyaluronan-based biomaterial (HYAff 11): molecular, immunohistochemical and ultrastructural analysis. Biomaterials 23:1187–1195 [DOI] [PubMed]
- 22.Haddo O, Mahroof S, Higgs D et al (2004) The use of chondrogide membrane in autologous chondrocyte implantation. Knee 11:51–55 [DOI] [PubMed]
- 23.Marlovits S, Zeller P, Singer P et al (2006) Cartilage repair: generations of autologous chondrocyte transplantation. Eur J Radiol 57:24–31 [DOI] [PubMed]
- 24.Pavesio A, Abatangelo G, Borrione A et al (2003) Hyaluronan-based scaffolds (Hyalograft C) in the treatment of knee cartilage defects: preliminary clinical findings. Novartis Found Symp 249:203–217 [PubMed]
- 25.Marcacci M, Berruto M, Brocchetta D et al (2005) Articular cartilage engineering with Hyalograft C: 3-year clinical results. Clin Orthop Relat Res (435):96–105 [DOI] [PubMed]
- 26.van Susante JL, Buma P, van Osch GJ et al (1995) Culture of chondrocytes in alginate and collagen carrier gels. Acta Orthop Scand 66:549–556 [DOI] [PubMed]
- 27.Disler DG, McCauley TR, Kelman CG et al (1996) Fat-suppressed three-dimensional spoiled gradient-echo MR imaging of hyaline cartilage defects in the knee: comparison with standard MR imaging and arthroscopy. AJR Am J Roentgenol 167:127–132 [DOI] [PubMed]
- 28.Potter HG, Linklater JM, Allen AA et al (1998) Magnetic resonance imaging of articular cartilage in the knee. An evaluation with use of fast-spin-echo imaging. J Bone Joint Surg Am 80:1276–1284 [DOI] [PubMed]
- 29.Recht M, Bobic V, Burstein D et al (2001) Magnetic resonance imaging of articular cartilage. Clin Orthop Relat Res (391 Suppl):S379–S396 [DOI] [PubMed]
- 30.Peterfy CG, van Dijke CF, Lu Y et al (1995) Quantification of the volume of articular cartilage in the metacarpophalangeal joints of the hand: accuracy and precision of three-dimensional MR imaging. AJR Am J Roentgenol 165:371–375 [DOI] [PubMed]
- 31.Kawahara Y, Uetani M, Nakahara N et al (1998) Fast spin-echo MR of the articular cartilage in the osteoarthrotic knee. Correlation of MR and arthroscopic findings. Acta Radiol 39:120–125 [DOI] [PubMed]
- 32.Peterfy CG, Majumdar S, Lang P et al (1994) MR imaging of the arthritic knee: improved discrimination of cartilage, synovium, and effusion with pulsed saturation transfer and fat-suppressed T1-weighted sequences. Radiology 191:413–419 [DOI] [PubMed]
- 33.Trattnig S, Huber M, Breitenseher MJ et al (1998) Imaging articular cartilage defects with 3D fat-suppressed echo planar imaging: comparison with conventional 3D fat-suppressed gradient echo sequence and correlation with histology. J Comput Assist Tomogr 22:8–14 [DOI] [PubMed]
- 34.Alparslan L, Minas T, Winalski CS (2001) Magnetic resonance imaging of autologous chondrocyte implantation. Semin Ultrasound CT MR 22:341–351 [DOI] [PubMed]
- 35.Bobic V (2000) ICRS articular cartilage imaging committee. ICRS MR imaging protocol for knee articular cartilage, p 12
- 36.Winalski CS, Minas T (2000) Evaluation of chondral injuries by magnetic resonance imaging: repair assessments. Oper Tech Sports Med 8:108–119 [DOI]
- 37.Roberts S, McCall IW, Darby AJ et al (2003) Autologous chondrocyte implantation for cartilage repair: monitoring its success by magnetic resonance imaging and histology. Arthritis Res Ther 5:R60–R73 [DOI] [PMC free article] [PubMed]
- 38.Recht MP, Piraino DW, Paletta GA et al (1996) Accuracy of fat-suppressed three-dimensional spoiled gradient-echo FLASH MR imaging in the detection of patellofemoral articular cartilage abnormalities. Radiology 198:209–212 [DOI] [PubMed]
- 39.Wada Y, Watanabe A, Yamashita T et al (2003) Evaluation of articular cartilage with 3D-SPGR MRI after autologous chondrocyte implantation. J Orthop Sci 8:514–517 [DOI] [PubMed]
- 40.Yao L, Gentili A, Thomas A (1996) Incidental magnetization transfer contrast in fast spin-echo imaging of cartilage. J Magn Reson Imaging 6:180–184 [DOI] [PubMed]
- 41.Chung CB, Frank LR, Resnick D (2001) Cartilage imaging techniques: current clinical applications and state of the art imaging. Clin Orthop Relat Res (391 Suppl):S370–S378 [PubMed]
- 42.Ruehm S, Zanetti M, Romero J et al (1998) MRI of patellar articular cartilage: evaluation of an optimized gradient echo sequence (3D-DESS). J Magn Reson Imaging 8:1246–1251 [DOI] [PubMed]
- 43.Stabler A, Spieker A, Bonel H et al (2000) Magnetic resonance imaging of the wrist-comparison of high resolution pulse sequences and different fat signal suppression techniques in cadavers. Rofo 172:168–174 [DOI] [PubMed]
- 44.Mosher TJ, Pruett SW (1999) Magnetic resonance imaging of superficial cartilage lesions: role of contrast in lesion detection. J Magn Reson Imaging 10:178–182 [DOI] [PubMed]
- 45.Gray ML, Eckstein F, Peterfy C et al (2004) Toward imaging biomarkers for osteoarthritis. Clin Orthop Relat Res S175–S181 [DOI] [PubMed]
- 46.Li K, Millington SA, Wu X et al (2005) simultaneous segmenation of multiple closed surfaces using optimal graph searching. Information Processing in Medical Imaging, 19th International Conference, IPMI 2005. Lecture Notes Computer Sci 3565:406–417 [DOI] [PubMed]
- 47.Rubenstein JD, Li JG, Majumdar S et al (1997) Image resolution and signal-to-noise ratio requirements for MR imaging of degenerative cartilage. AJR Am J Roentgenol 169:1089–1096 [DOI] [PubMed]
- 48.Marlovits S, Striessnig G, Resinger CT et al (2004) Definition of pertinent parameters for the evaluation of articular cartilage repair tissue with high-resolution magnetic resonance imaging. Eur J Radiol 52:310–319 [DOI] [PubMed]
- 49.Fuchsjager MH, Mlynarik V, Marlovits S et al (2004) High field MR imaging in reconstituted articular cartilage: evaluation of cartilage maturation for determination of optimal transplantation time. Radiology 233:203
- 50.Smith HE, Mosher TJ, Dardzinski BJ et al (2001) Spatial variation in cartilage T2 of the knee. J Magn Reson Imaging 14:50–55 [DOI] [PubMed]
- 51.Mosher TJ, Dardzinski BJ, Smith MB (2000) Human articular cartilage: influence of aging and early symptomatic degeneration on the spatial variation of T2-preliminary findings at 3 T. Radiology 214:259–266 [DOI] [PubMed]
- 52.Bashir A, Gray ML, Hartke J et al (1999) Nondestructive imaging of human cartilage glycosaminoglycan concentration by MRI. Magn Reson Med 41:857–865 [DOI] [PubMed]
- 53.Burstein D, Velyvis J, Scott KT et al (2001) Protocol issues for delayed Gd(DTPA)(2-)-enhanced MRI (dGEMRIC) for clinical evaluation of articular cartilage. Magn Reson Med 45:36–41 [DOI] [PubMed]
- 54.Kimelman T, Vu A, Li B et al (2004) Preliminary experience with dGEMRIC at 3T. Proceedings of the International Society of Magnetic Resonance Medicine, 12th scientific meeting, Kyoto, Japan, No 832
- 55.Nieminen MT, Winalski C, Rieppo J et al (2004) Multi-parameteric MRI assessment of cartilage repair with correlation to histology. Proceedings of the International Society of Magnetic Resonance Medicine, 12th scientific meeting, Kyoto, Japan, No. 239
- 56.Nieminen MT, Rieppo J, Toyras J et al (2001) T2 relaxation reveals spatial collagen architecture in articular cartilage: a comparative quantitative MRI and polarized light microscopic study. Magn Reson Med 46:487–493 [DOI] [PubMed]
- 57.Buckwalter JA (1999) Evaluating methods of restoring cartilaginous articular surfaces. Clin Orthop Relat Res (367 Suppl):S224–S238 [DOI] [PubMed]
- 58.Marlovits S, Singer P, Zeller P et al (2006) Magnetic resonance observation of cartilage repair tissue (MOCART) for the evaluation of autologous chondrocyte transplantation: Determination of interobserver variability and correlation to clinical outcome after 2 years. Eur J Radiol 57:16–23 [DOI] [PubMed]
- 59.Link TM, Mischung J, Wortler K et al (2006) Normal and pathological MR findings in osteochondral autografts with longitudinal follow-up. Eur Radiol 16:88–96 [DOI] [PubMed]
- 60.Herber S, Runkel M, Pitton MB et al (2003) Indirect MR-arthrography in the follow up of autologous osteochondral transplantation. Rofo 175:226–233 [DOI] [PubMed]
- 61.Sanders TG, Mentzer KD, Miller MD et al (2001) Autogenous osteochondral “plug” transfer for the treatment of focal chondral defects: postoperative MR appearance with clinical correlation. Skelet Radiol 30:570–578 [DOI] [PubMed]
- 62.Trattnig S, Ba-Ssalamah A, Pinker K et al (2005) Matrix-based autologous chondrocyte implantation for cartilage repair: noninvasive monitoring by high-resolution magnetic resonance imaging. Magn Reson Imaging 23:779–787 [DOI] [PubMed]
- 63.Tins BJ, McCall IW, Takahashi T et al (2005) Autologous chondrocyte implantation in knee joint: MR imaging and histologic features at 1-year follow-up. Radiology 234:501–508 [DOI] [PubMed]
- 64.Trattnig S, Pinker K, Krestan C et al (2006) Matrix-based autologous chondrocyte implantation for cartilage repair with Hyalograft((R))C: two-year follow-up by magnetic resonance imaging. Eur J Radiol 57:9–15 [DOI] [PubMed]
- 65.Azer NM, Winalski CS, Minas T (2004) MR imaging for surgical planning and postoperative assessment in early osteoarthritis. Radiol Clin North Am 42:43–60 [DOI] [PubMed]
- 66.Bartlett W, Skinner JA, Gooding CR et al (2005) Autologous chondrocyte implantation versus matrix-induced autologous chondrocyte implantation for osteochondral defects of the knee: a prospective, randomised study. J Bone Joint Surg Br 87:640–645 [DOI] [PubMed]
- 67.Minas T, Peterson L (2000) Autologous chondrocyte transplantation. Oper Techniques Sports Med 8:144–157 [DOI] [PubMed]
- 68.Gold GE, Bergman AG, Pauly JM et al (1998) Magnetic resonance imaging of knee cartilage repair. Top Magn Reson Imaging 9:377–392 [DOI] [PubMed]
- 69.Burkart A, Imhoff AB (2000) Diagnostic imaging after autologous chondrocyte transplantation. Correlation of magnetic resonance tomography, histological and arthroscopic findings. Orthopade 29:135–144 [DOI] [PubMed]
- 70.Peterson L, Brittberg M, Kiviranta I et al (2002) Autologous chondrocyte transplantation. Biomechanics and long-term durability. Am J Sports Med 30:2–12 [DOI] [PubMed]
- 71.Modl JM, Sether LA, Haughton VM et al (1991) Articular cartilage: correlation of histologic zones with signal intensity at MR imaging. Radiology 181:853–855 [DOI] [PubMed]
- 72.James SL, Connell DA, Saifuddin A et al (2006) MR imaging of autologous chondrocyte implantation of the knee. Eur Radiol 16:1022–1030 [DOI] [PubMed]
- 73.Schweitzer ME, White LM (1996) Does altered biomechanics cause marrow edema? Radiology 198:851–853 [DOI] [PubMed]
- 74.Briggs TW, Mahroof S, David LA et al (2003) Histological evaluation of chondral defects after autologous chondrocyte implantation of the knee. J Bone Joint Surg Br 85:1077–1083 [DOI] [PubMed]


