Figure 3.
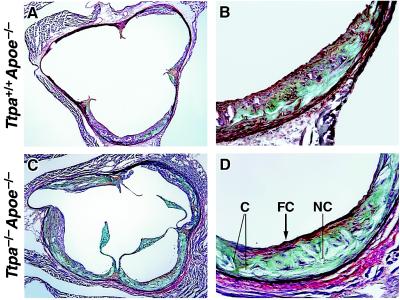
Morphology of aortic lesions from proximal aortic roots. Representative section from the aortic root (at the level of the first coronary) showing lesions in Ttpa+/+Apoe−/− mouse at low- (×4) (A) and high-magnification detail of lower right profile in A (×20). (B) Representative section at the aortic root lesion from Ttpa−/−Apoe−/− mouse at low- (×4) (C) and high-magnification detail of lower right profile in C (×20). (D) Lesions in Ttpa−/−Apoe−/− mice show more complex features, including a large necrotic core (NC), numerous needle-shaped lucencies indicative of cholesterol crystals (C), and fibrous capping (FC) from smooth muscle cells (stained red). Within the lesion core, greenish-blue staining represents proteoglycan, and yellow staining represents collagen.

