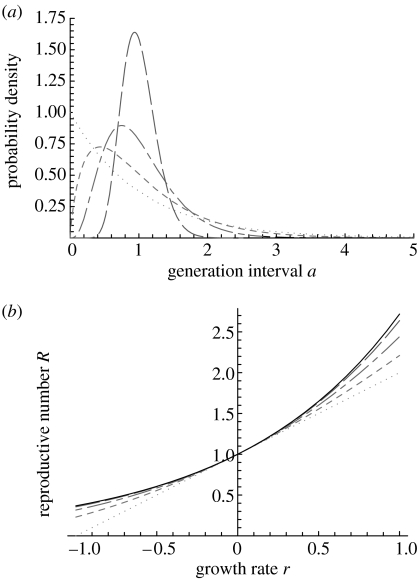
Figure 1.
Generation interval distributions uniquely characterize the relationship between the reproductive number R and the growth rate r: (a) generation interval distributions g(a) with identical mean Tc and increasing coefficient of variation σ/Tc from 0.25 (long dashes), 0.5 (long and short dashes), 0.75 (short dashes) to 1 (dots) and (b) the corresponding relationships between growth rate r and reproductive number R, the drawn curve indicates the upper bound obtained for the delta distribution.

