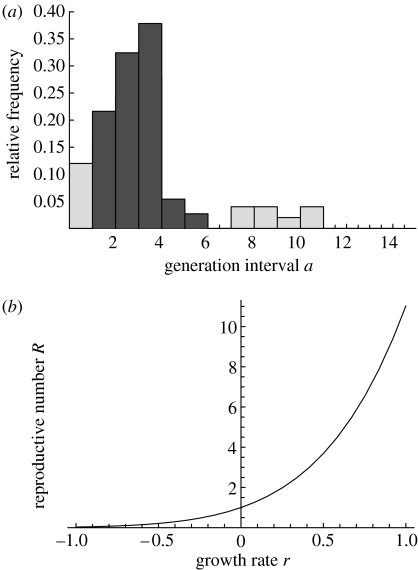
Figure 2.
Observed generation intervals for influenza A virus infections and the empirical relationship between reproductive number and growth rate: (a) histogram of observed generation intervals between two subsequent influenza cases in a household (after Hirotsu et al. 2004), the lighter shading indicates observations that could be due to co-primary or tertiary infections and (b) the corresponding empirical relationship between R and r, according to equation (3.6).

