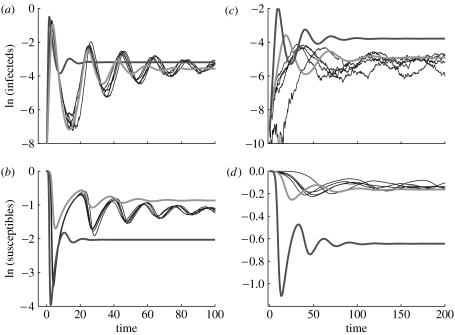
Figure 2.
Comparison of the population dynamics of (a, c) infected and (b, d) susceptible proportions for two mean-field models and the stochastic model of transmission in a small-world network. Two different values of the transmission parameter were used: (a, b) τ=1 and (c, d) τ=0.25. A set of stochastic simulations are shown in blue (with network parameters ϕ=0.1 and N=90 000). Solutions for the standard mean-field model 3.1 are shown in red and those for the modified mean-field model 3.2–3.5 are shown in green (μ=0.05, r=1, γ=r+μ).

