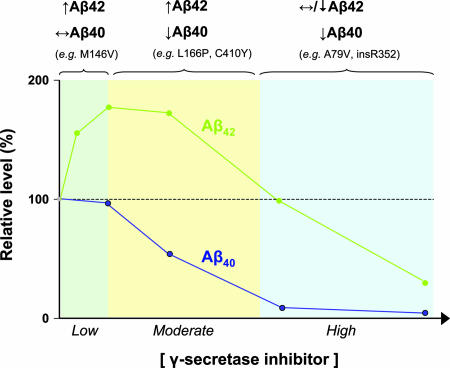
Fig. 3.
γ-Secretase inhibitors mimic the effects of pathogenic PS mutations. The graph depicts schematically the effects of increasing concentrations of γ-secretase inhibitors on Aβ40 and Aβ42 production, based on data from published reports (32–41). Similar findings have been reported with inhibitors of different structural classes, assayed in either cell culture systems or partially purified membrane preparations. Three distinct patterns of change in the levels of Aβ40 and Aβ42 production are observed in response to increasing concentrations of γ-secretase, as indicated above the graph: (i) increased Aβ42 and unchanged Aβ40; (ii) increased Aβ42 and decreased Aβ40; and (iii) unchanged or decreased Aβ42 and decreased Aβ40. Pathogenic PS mutations can be classified into similar patterns based on their effect on Aβ42 and Aβ40 (representative mutations are shown for each pattern), with most mutations corresponding to the intermediate pattern. Thus, the impact of PS mutations on γ-secretase activity can be equated with the effects of varying concentrations of an active site-directed γ-secretase inhibitor. Note that the Aβ42/Aβ40 ratio is consistently increased across all concentrations of γ-secretase inhibitor, suggesting that this ratio provides a more reliable index of γ-secretase inhibition than the individual levels of Aβ42 or Aβ40.

