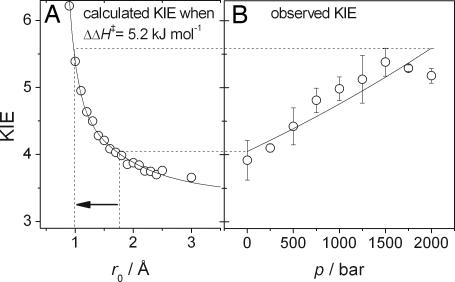
Fig. 4.
Correlation of observed KIEs with calculated r0 values as a function of pressure. (A) The calculated KIE dependence on r0 from Eqs. 4 and 5 (shown in Fig. 3) when ΔΔH‡ is fixed to 5.2 kJ·mol−1. (B) The measured KIE versus p at 25°C. The solid line is a fit to KIE = k0,H/k0,D exp(−ΔΔV‡p/RpT). The increase in observed KIE is consistent with a decrease in the equilibrium separation, r0, from ≈1.7 Å to ≈1.0 Å (depicted by the arrow).

