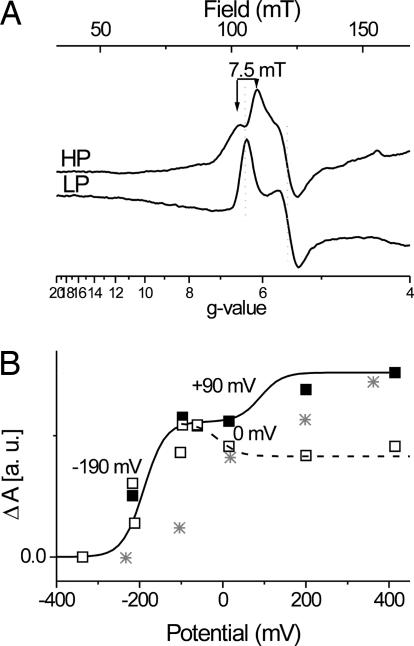
Fig. 4.
Evaluation of ci 's redox behavior. (A) Redox-induced EPR difference spectra of the high-spin heme signals of the isolated b6f complex from C. reinhardtii in the presence of 66 μM NQNO are shown; HP is +414/+200 mV; LP is −217/−337 mV. EPR settings are as for Fig. 1. (B) Signal amplitudes are plotted versus ambient redox potential: ■, gy signal at 5.5; □, difference of the amplitudes of the gx signals at 6.5 and 6.1. Two n = 1 Nernst curves were fitted to each set of data points. Asterisks indicate signal amplitude of the gy signal at 5.32 from the titration without inhibitor versus ambient redox potential.

