
Figure 2.
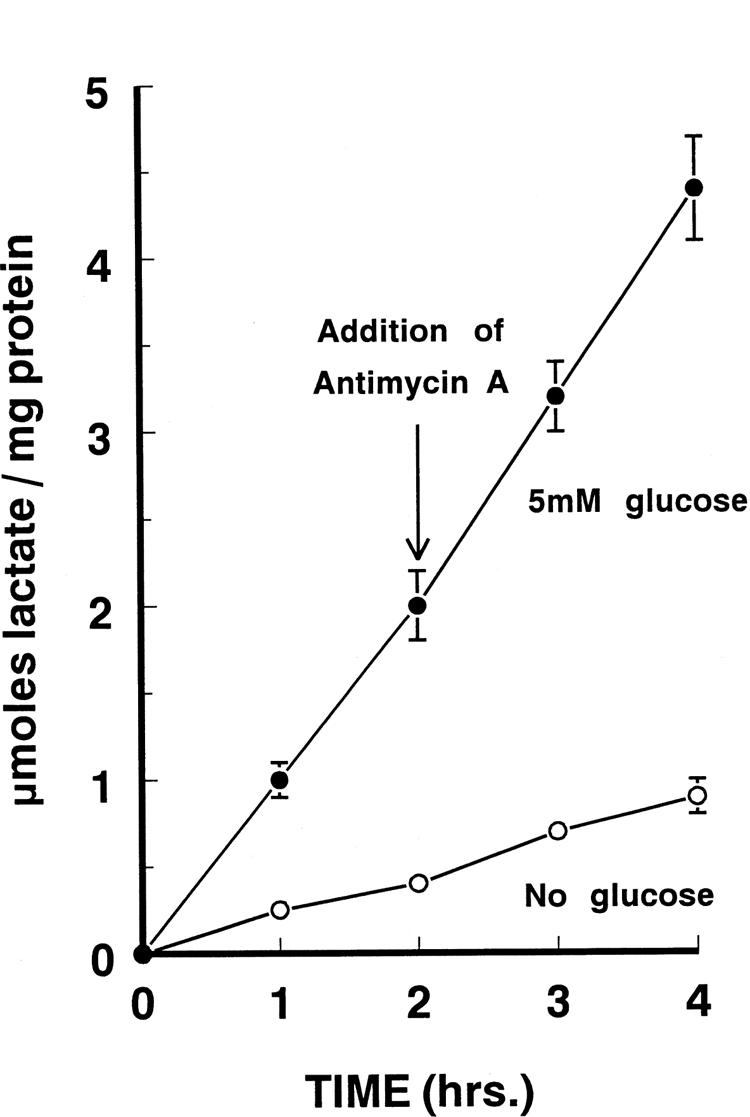
Rates of lactate production by cultured human retinal Müller cells as a function of time of incubation in the presence and absence of glucose. After 2 hours of culture in control media, 1 × 10⁻⁵ M antimycin A (final concentration) was added to the medium, and the rate of accumulation of lactate in the media was observed for an additional 2 hours. Each point represents the mean ± SD of 8 to 10 individual experiments (triplicate wells per experiment). When not shown, the SDs were smaller than the size of the symbol. (●), With glucose; (○), without glucose.