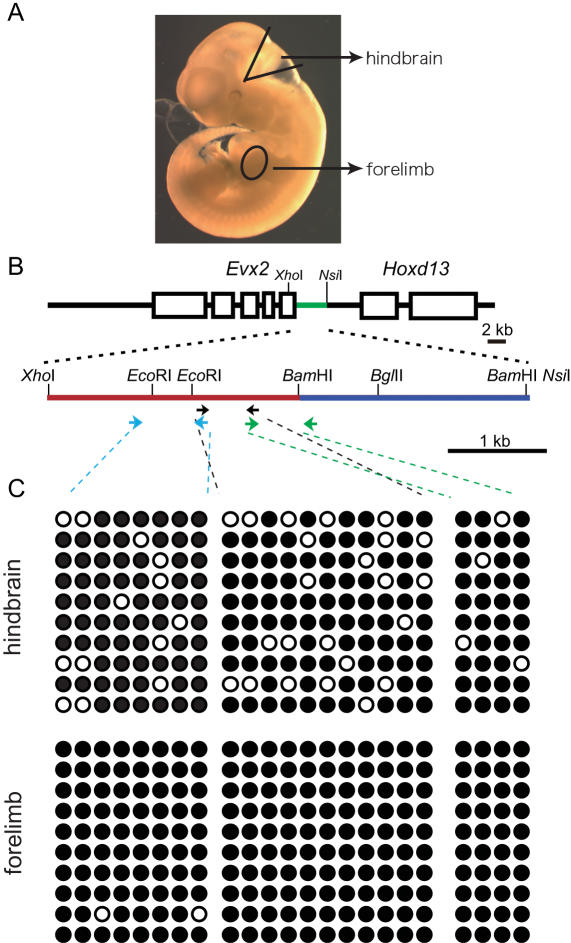
Figure 4.
Methylation profile of insulator fragment. (A) Hindbrain and forelimbs were dissected from 11 dpc embryos to obtain the DNA used for the methylation assays. (B) Map of the tested fragment. Red line represents the insulator (XB fragment) and blue line represents the regulator (BB fragment). Bisulfite-treated genomic DNA was subjected to PCR using three sets of primers (indicated by arrows; see Experimental Procedures). Primer pairs for one PCR reaction have matching arrow color. (C) Ten clones from each PCR product were sequenced. Their methylation status is shown here. White circles represent methylated cytosine residues, while black circles represent non-methylated cytosine residues.

