
Figure 2.
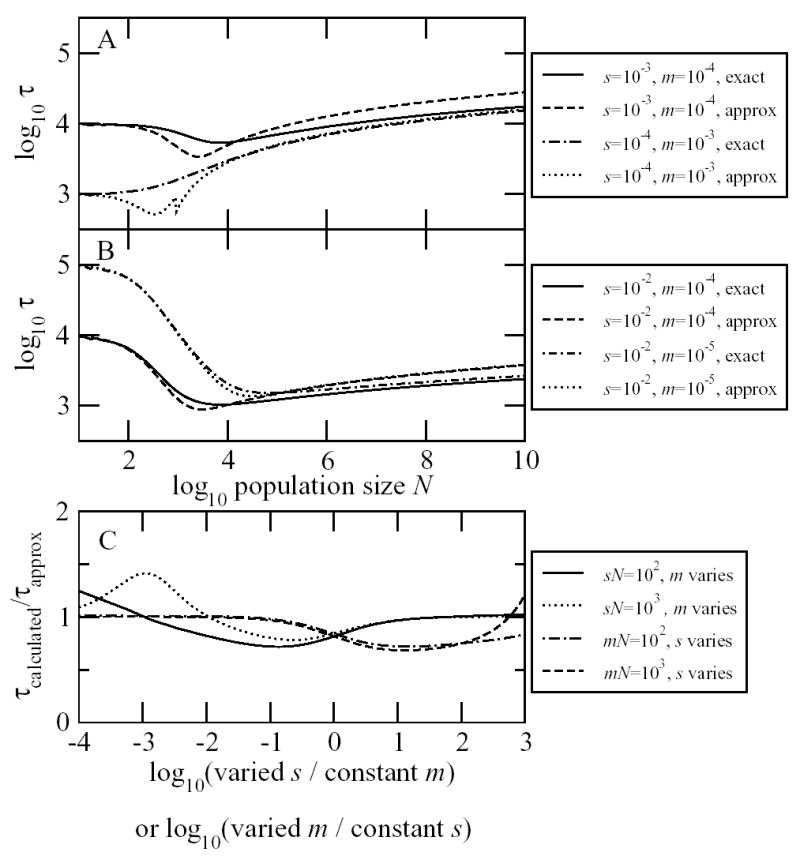
The mean sojourn time as a function of the population size N, the mutation rate m and the selection coefficient s, as calculated exactly by Eqs. A1 and A2 and approximately by Eq. 3. A and B. We see different behavior of depending on whether mN < 1 or mN > 1. C. The approximate formula is reasonably accurate for a wide range of parameter values. Calculations shown were performed with N = 106.